Histogram Data for Assignment
Question
Task 2 10 Marks
The data set for group assignment you can find on Blackboard in the folder assignment.
Required:
Activity 01:
Enter all data from the spreadsheet “Data for Assignment “into Excel. You will need to set up the variable view with the following 11 variables and then enter the data in excel:
- Student_ID,
- Year_Enrolled,
- HI001_Final_Exam,
- HI001_Assignment_01,
- HI001_Assignment_02,
- HI002_Final_Exam,
- HI002_Assignment_01,
- HI002_Assignment_02,
- HI003_Final_Exam,
- HI003_Assignment_01,
- HI003_Assignment_02.
Activity 02:
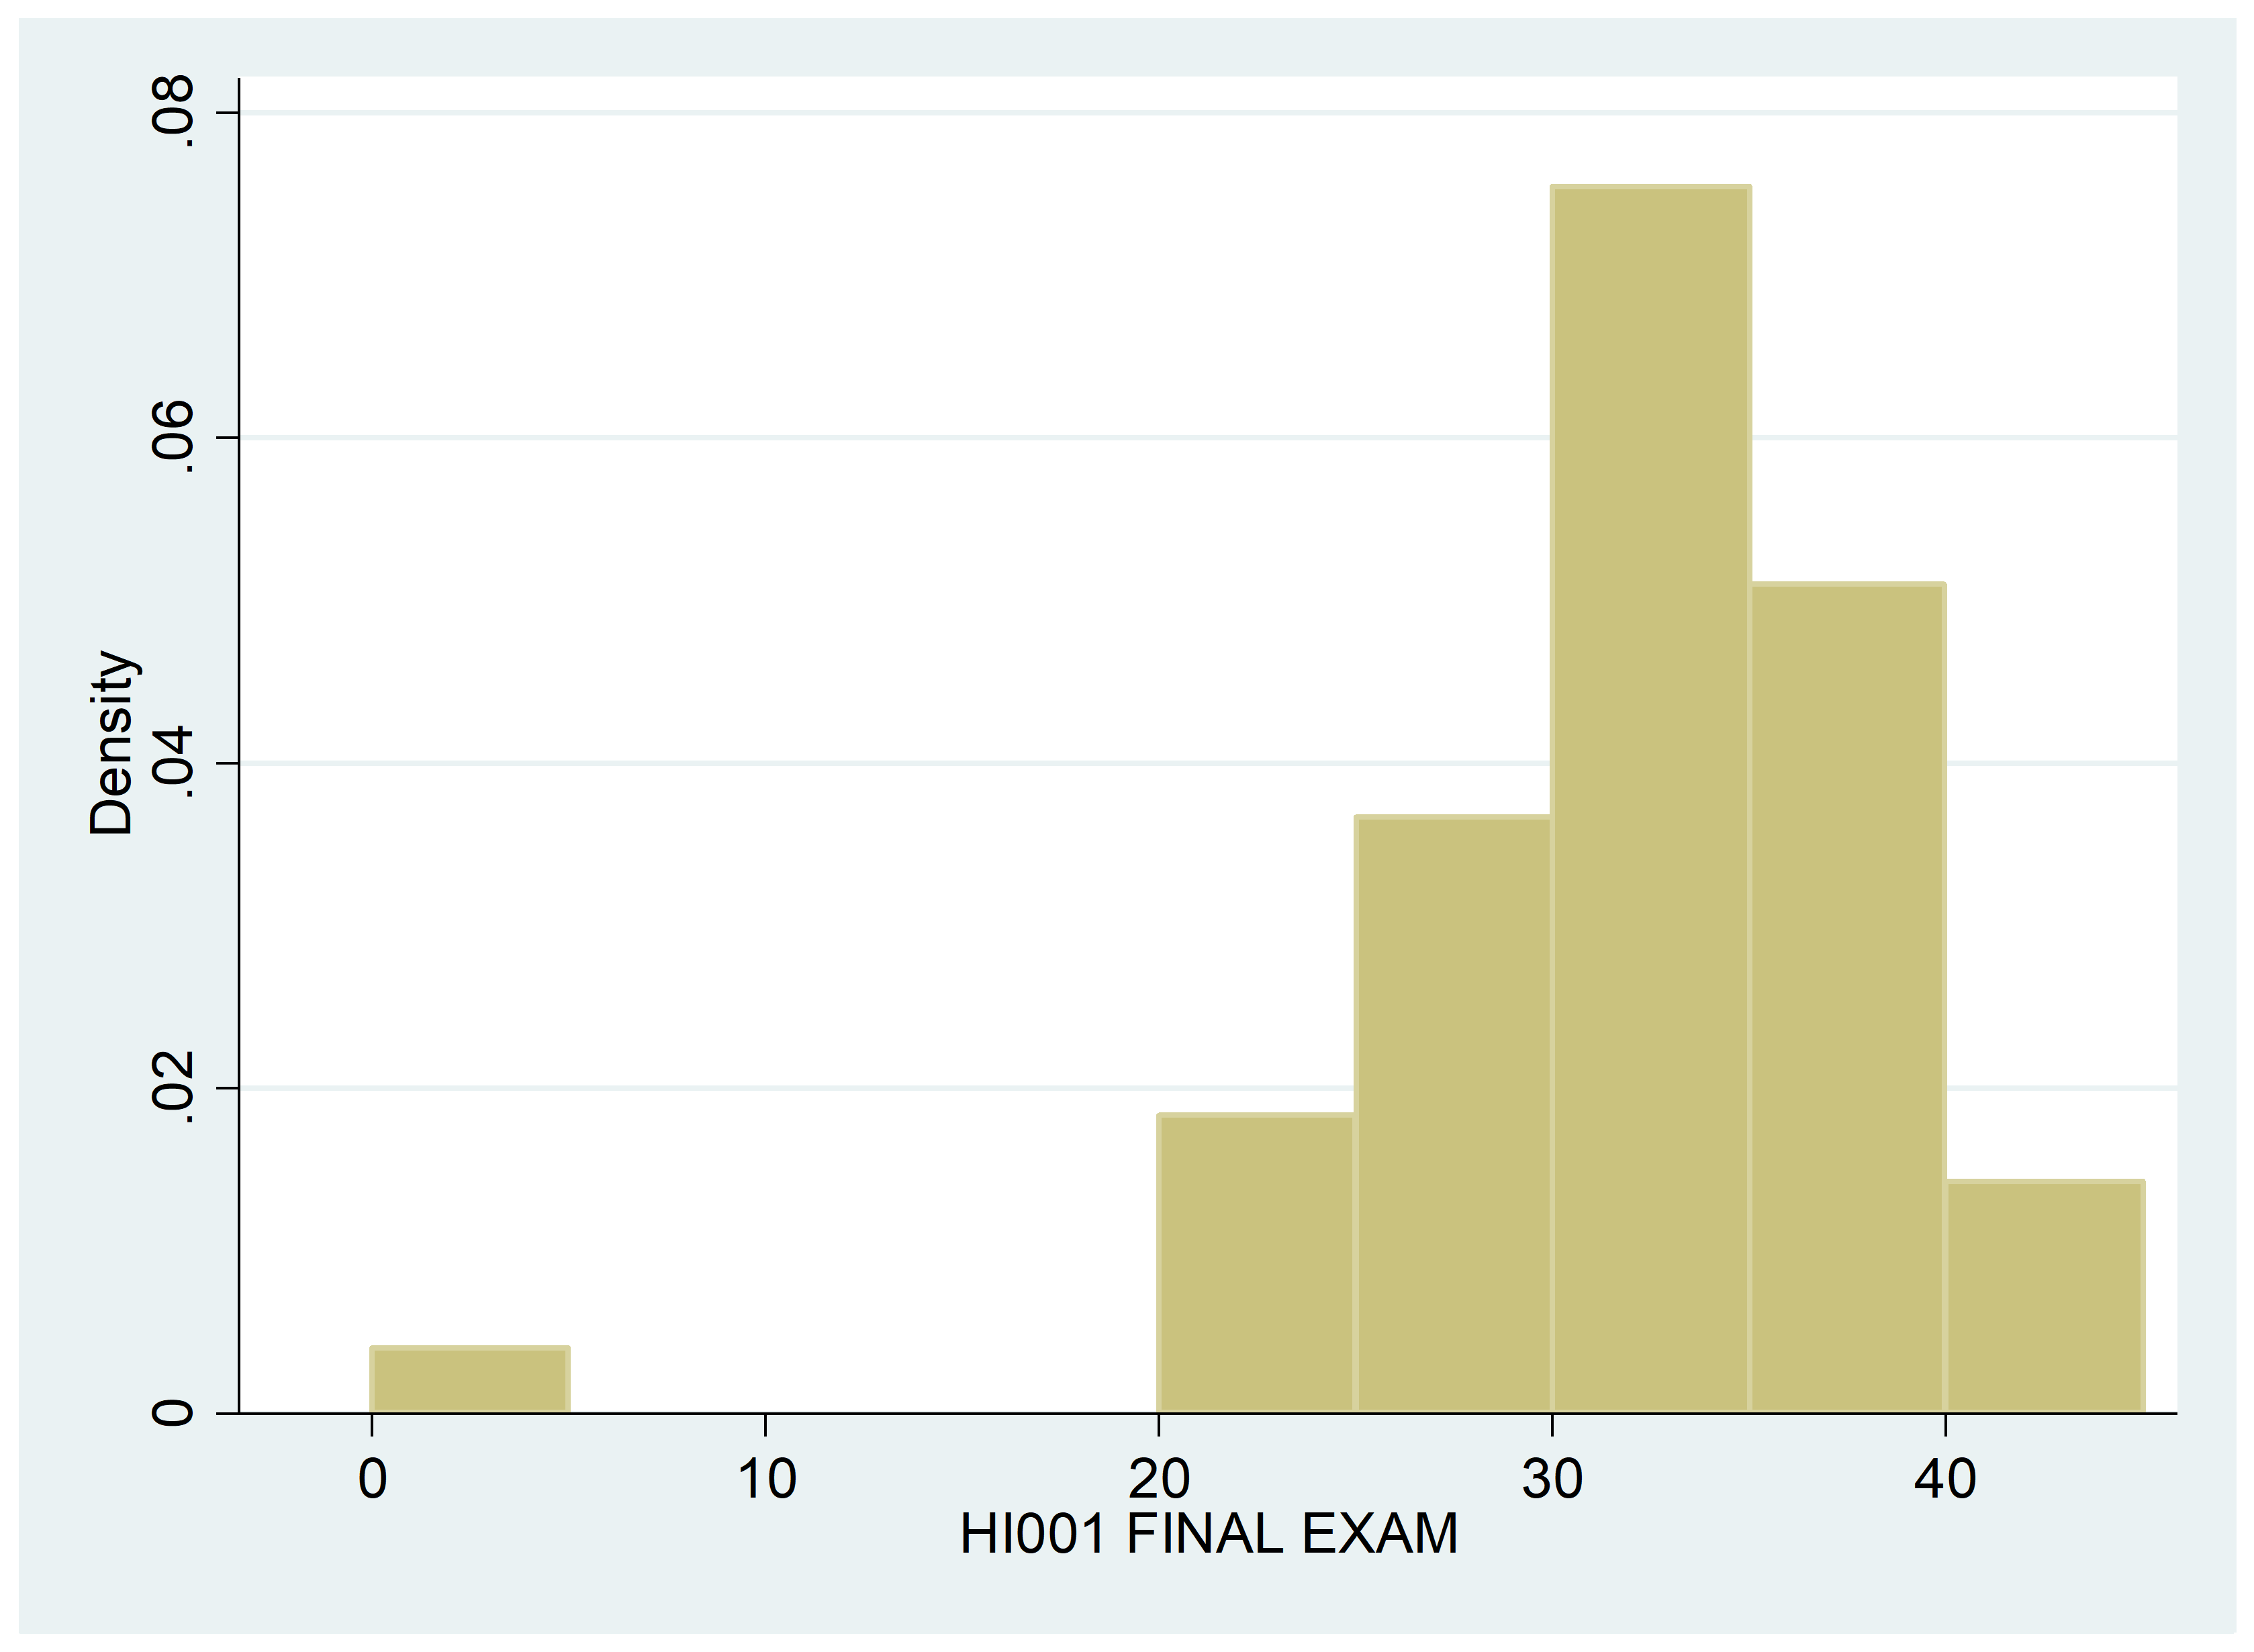
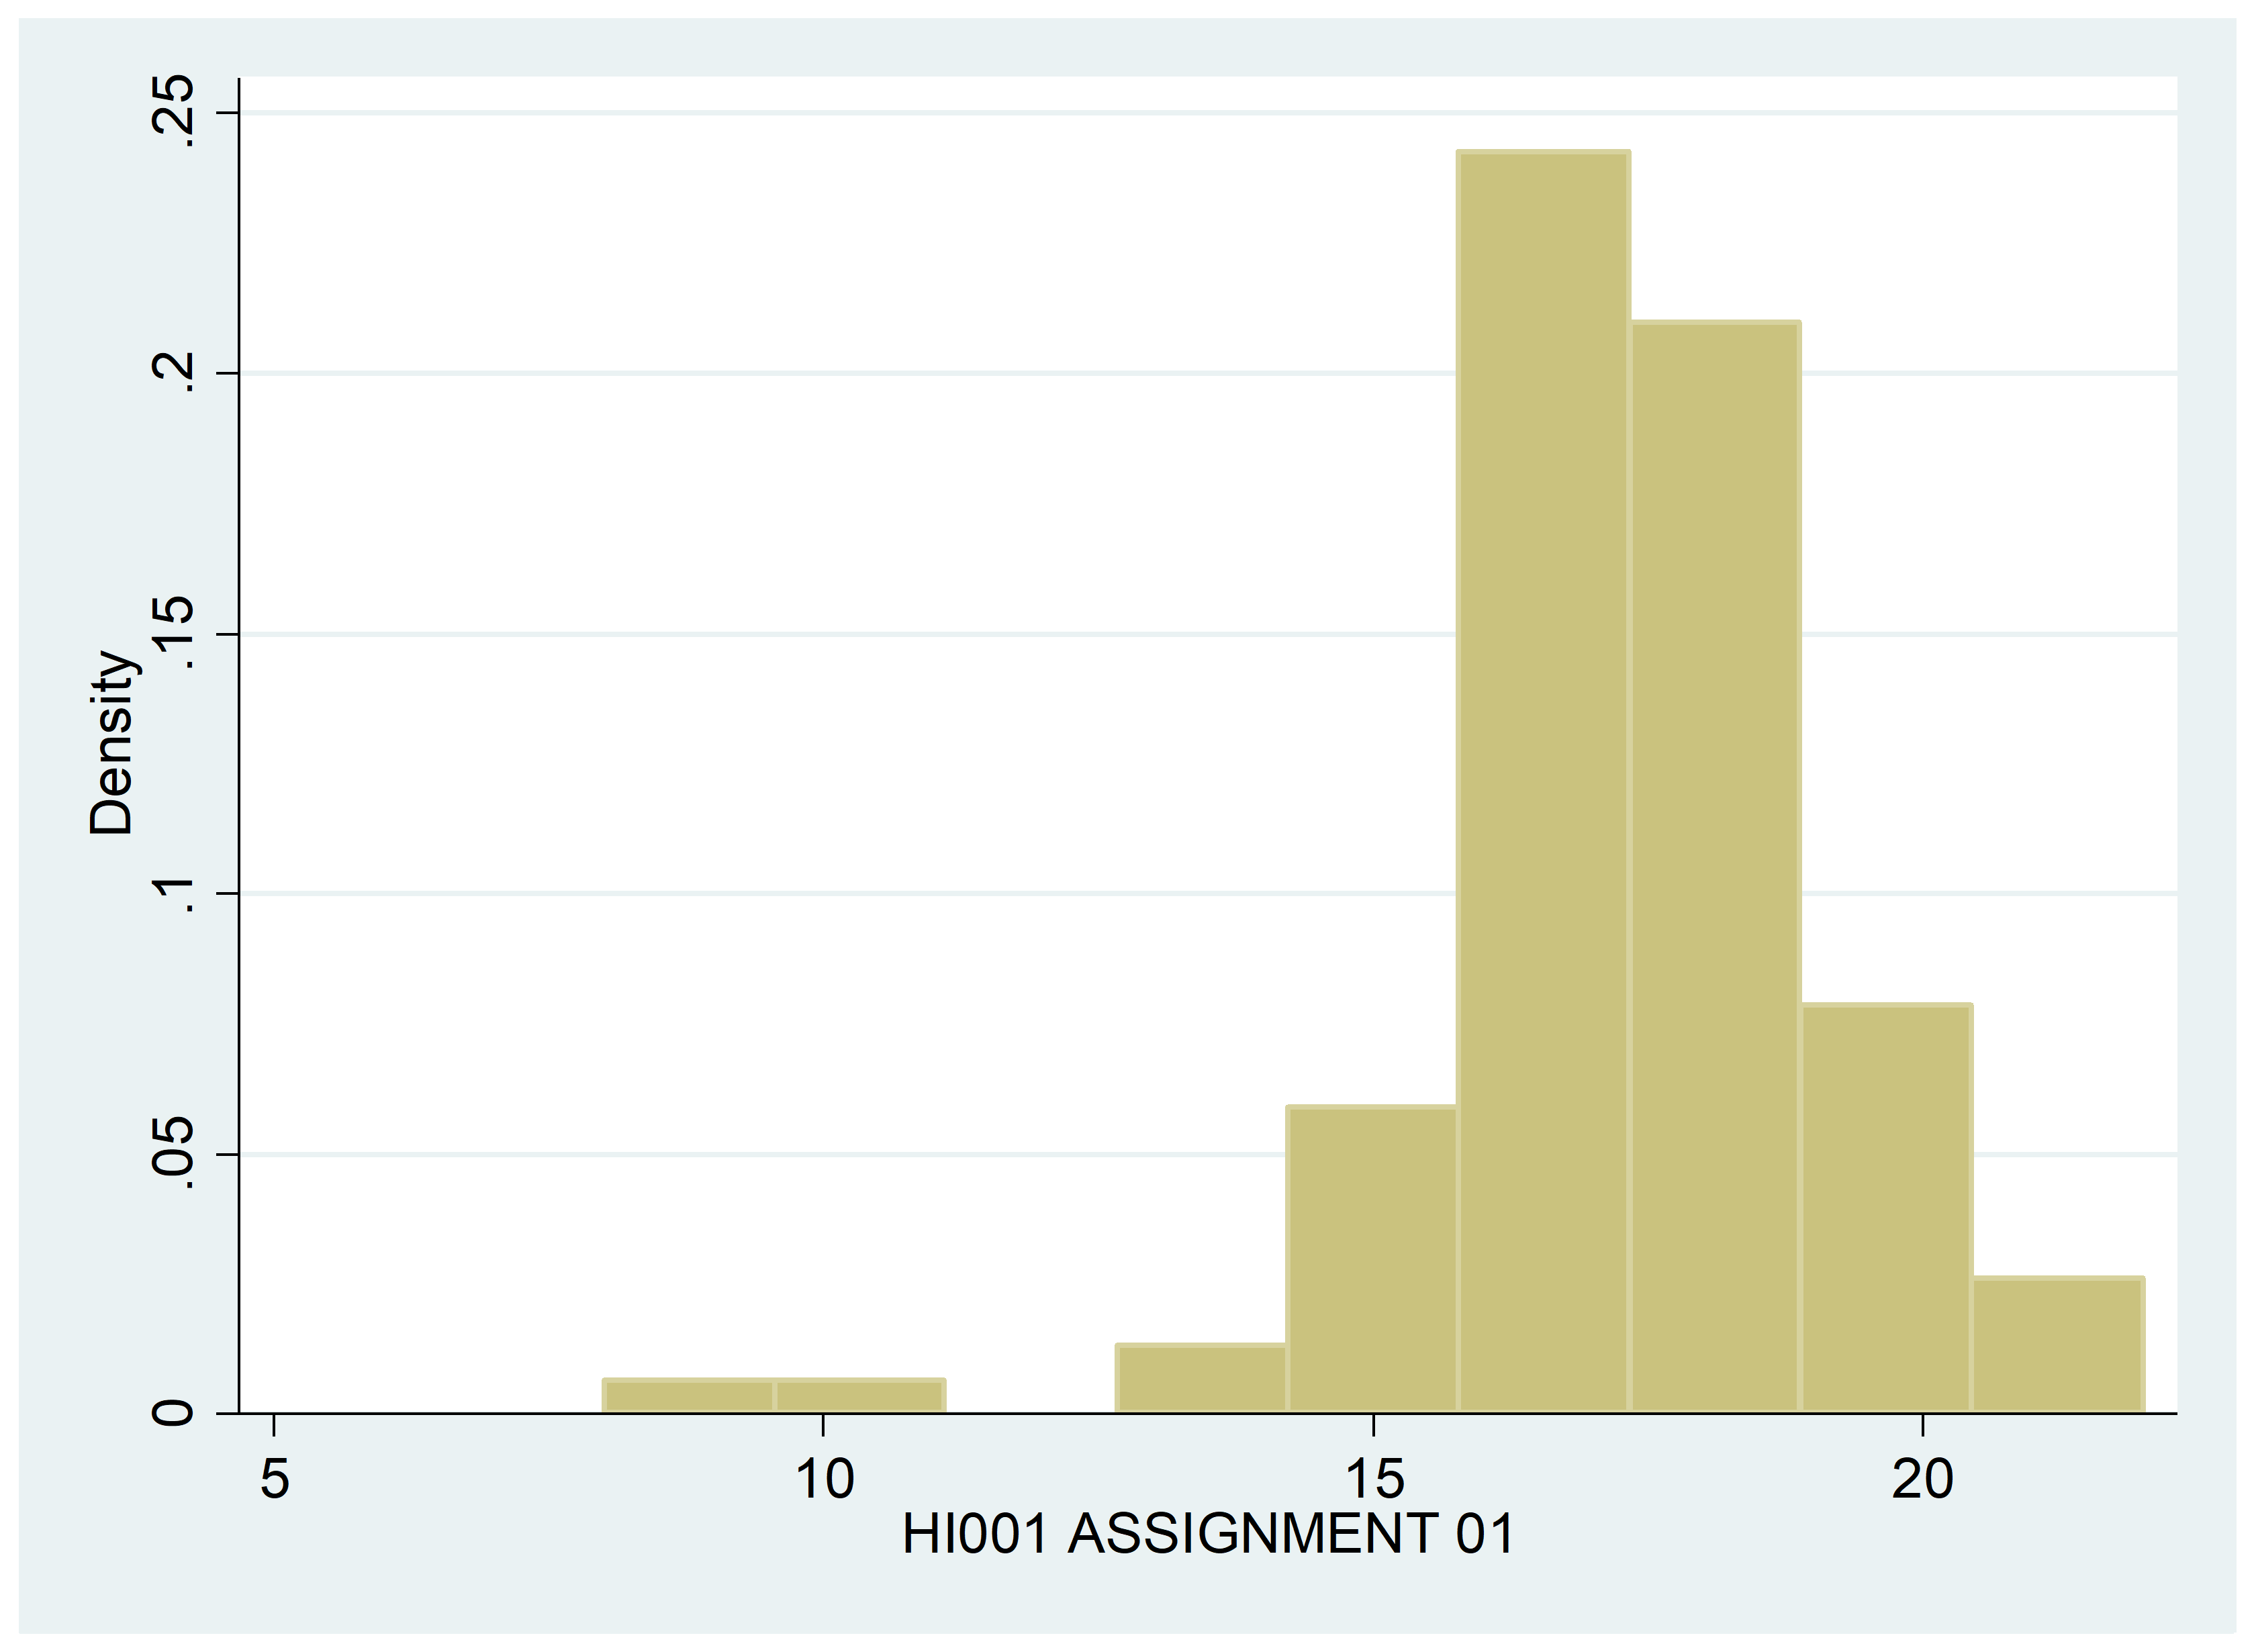
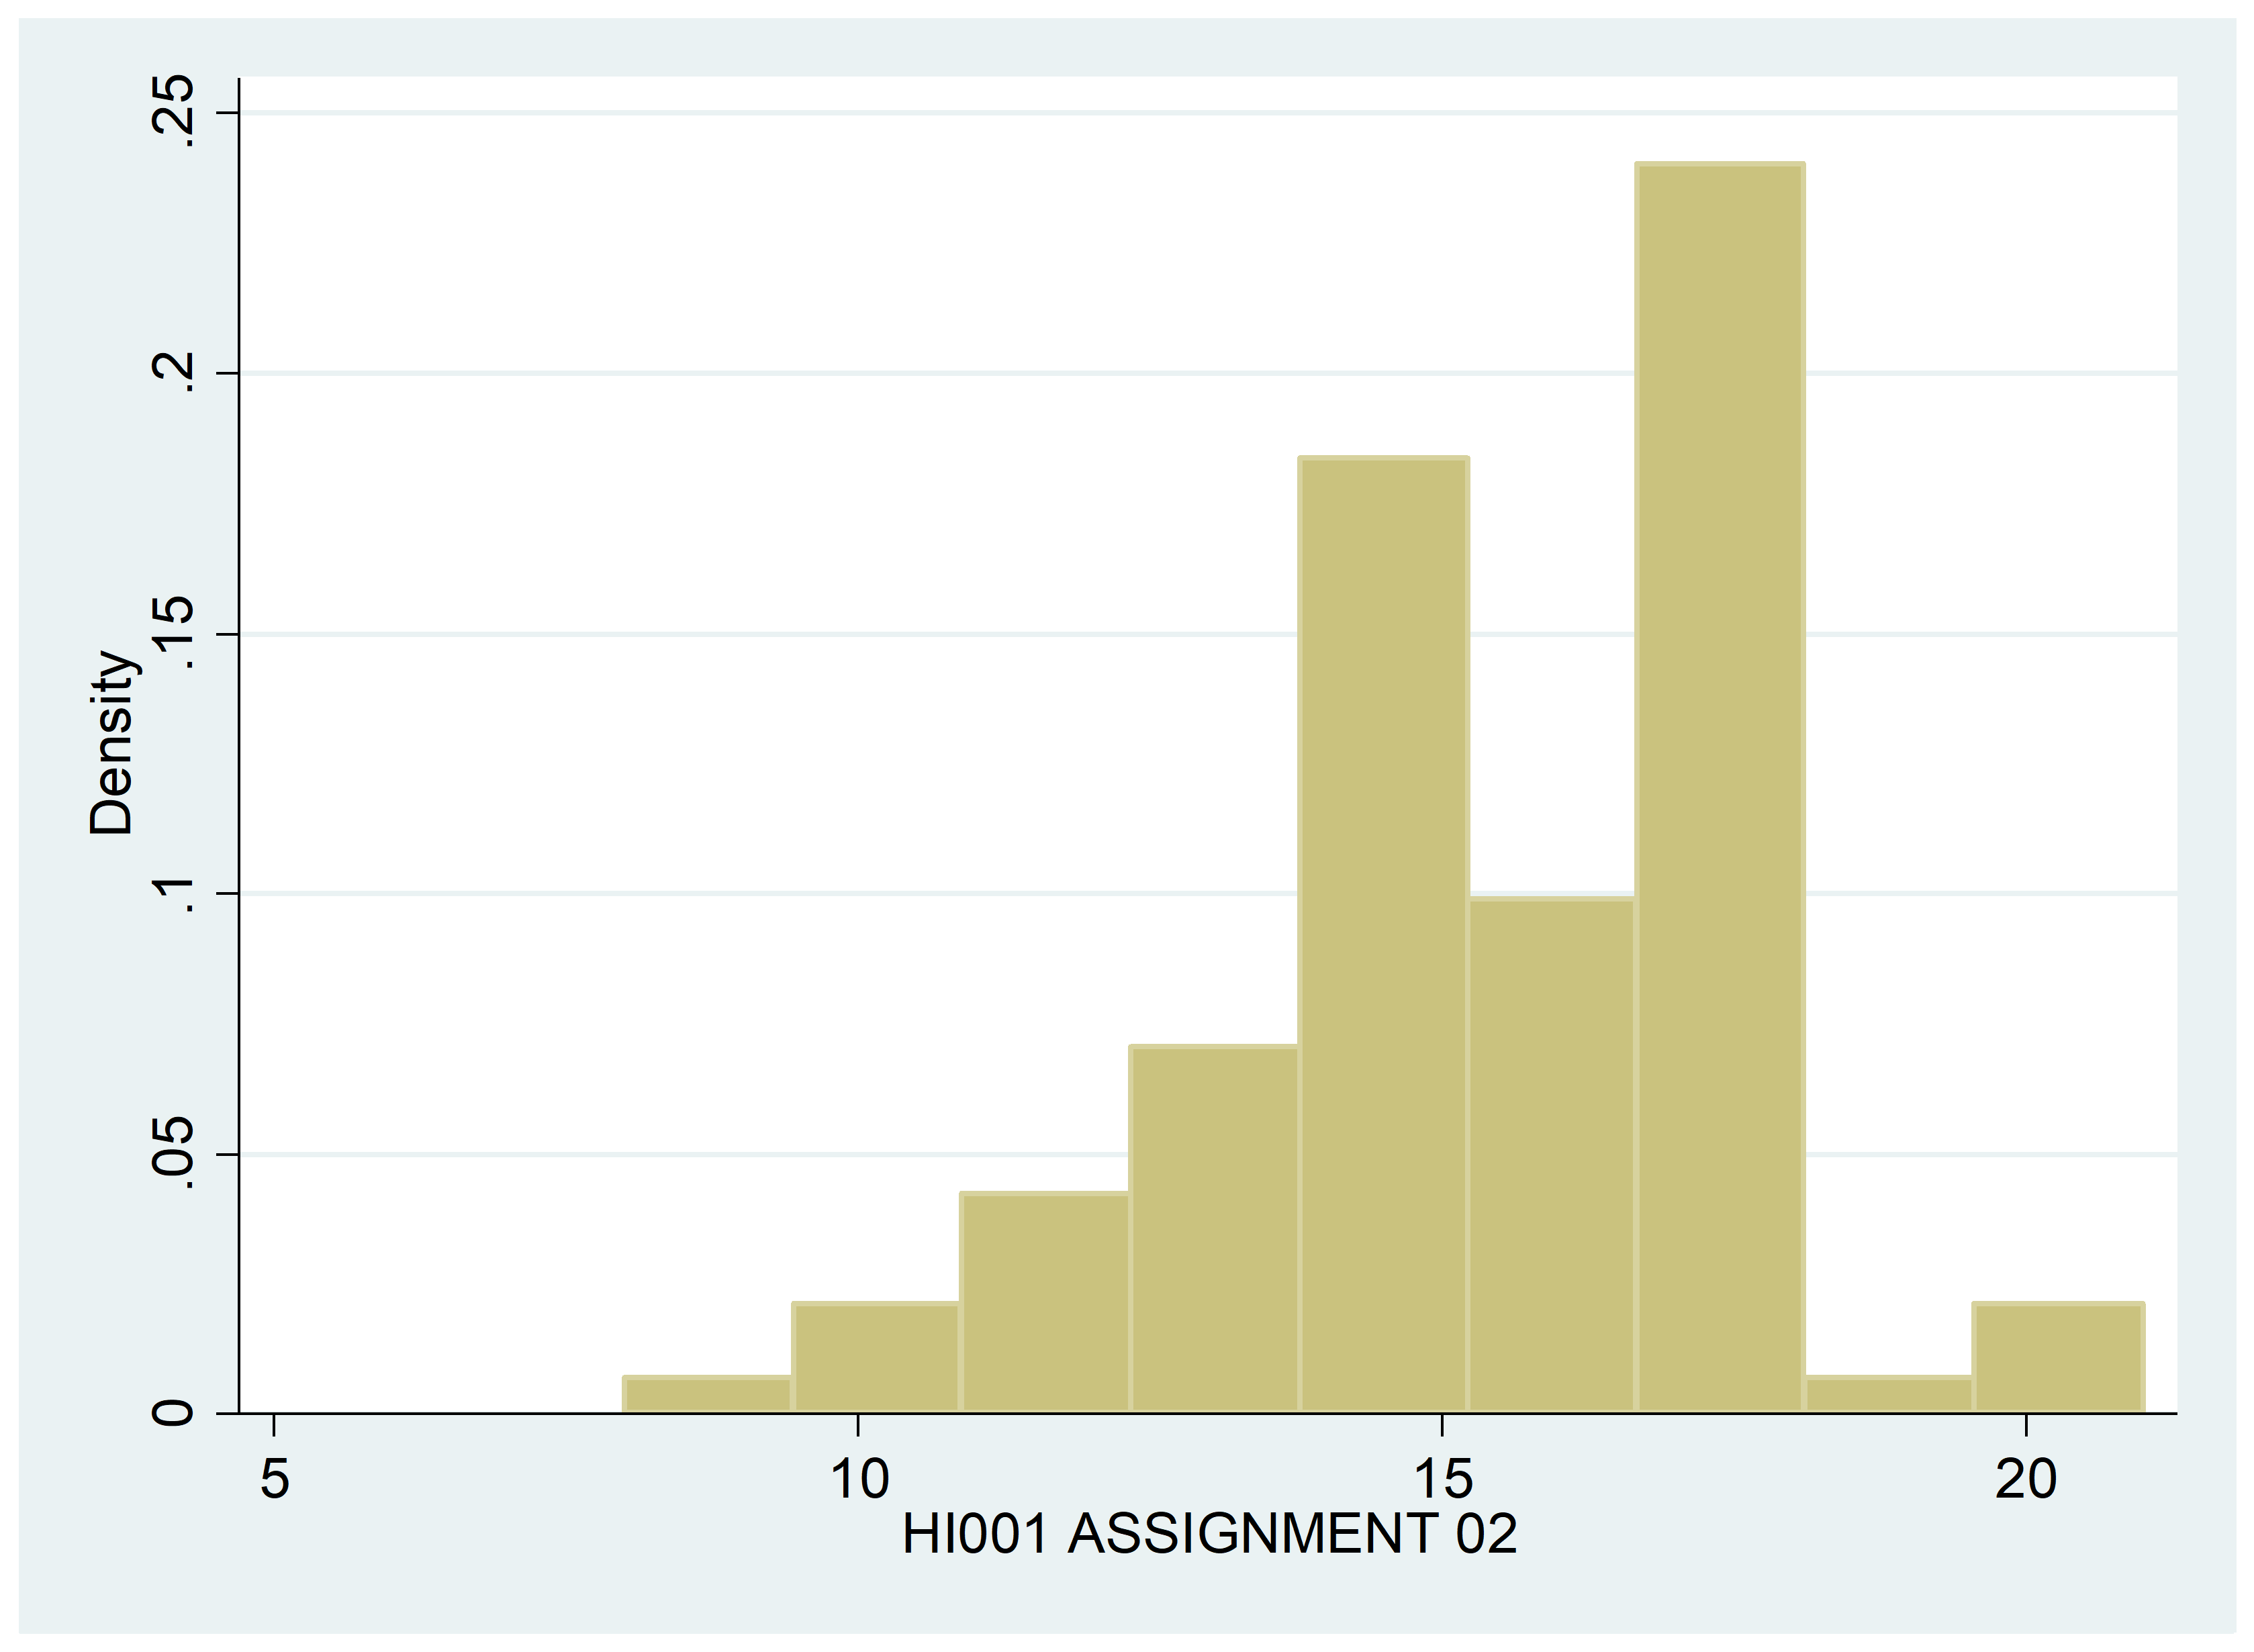
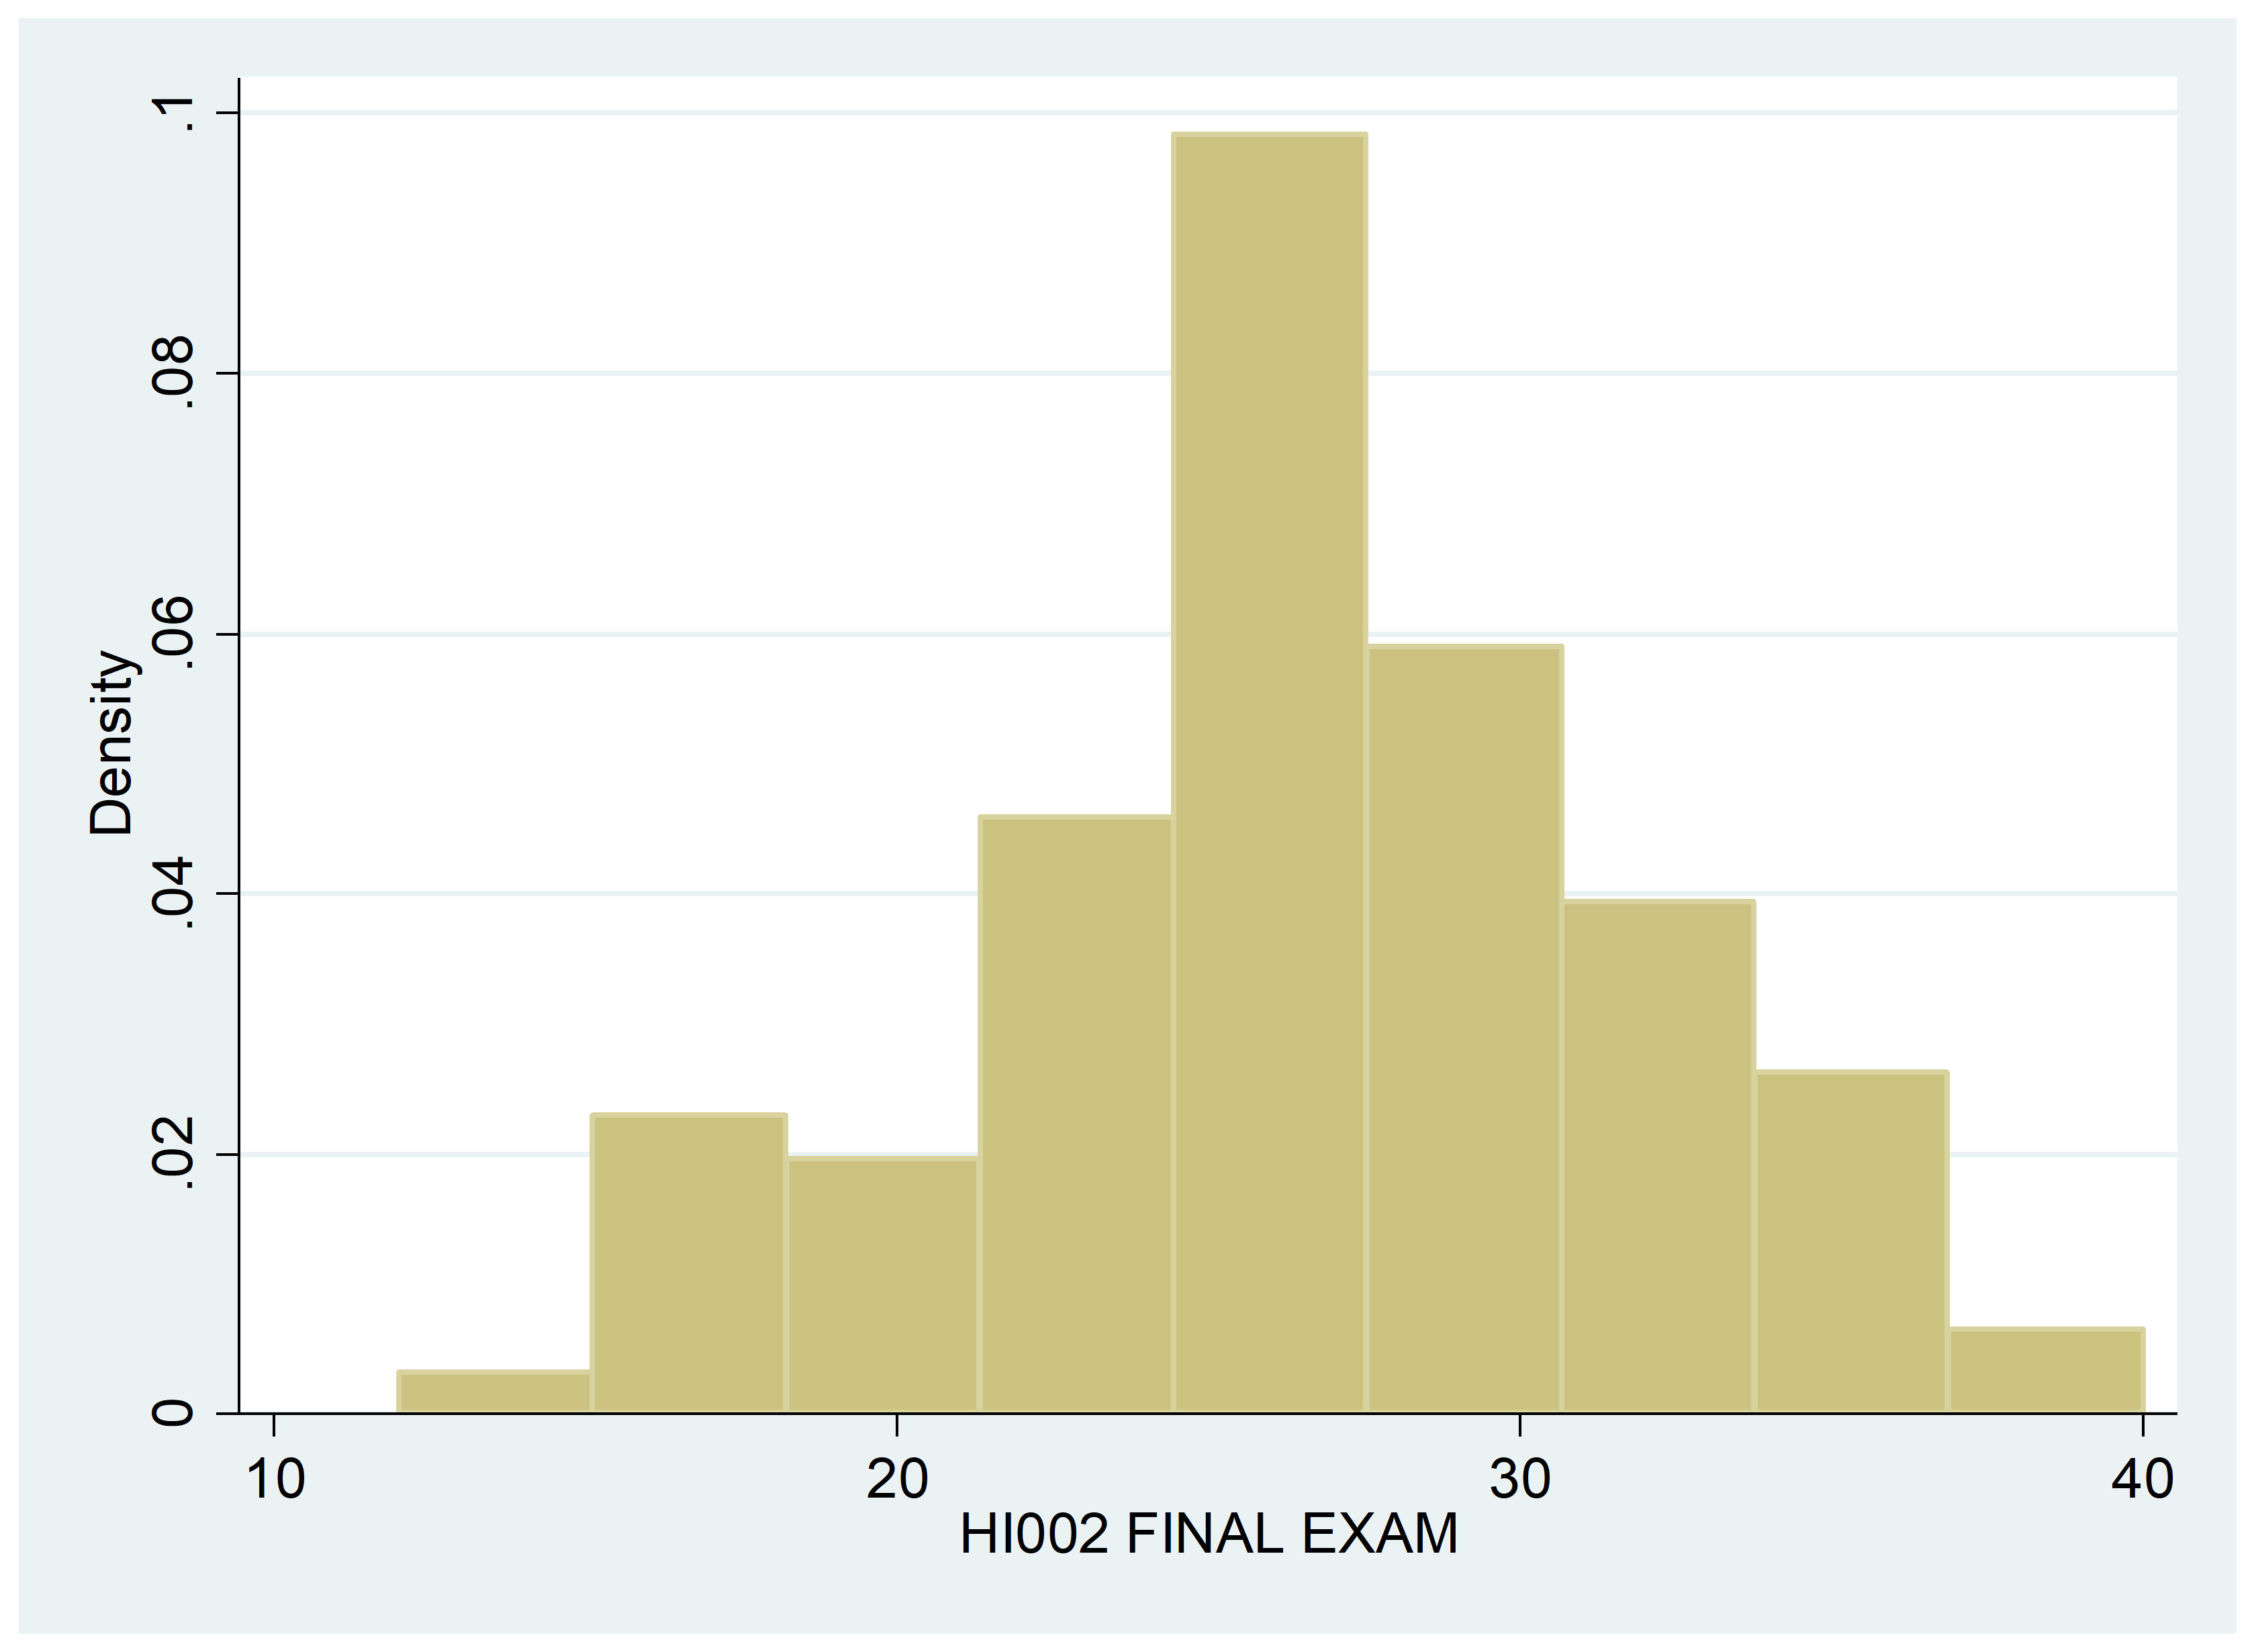
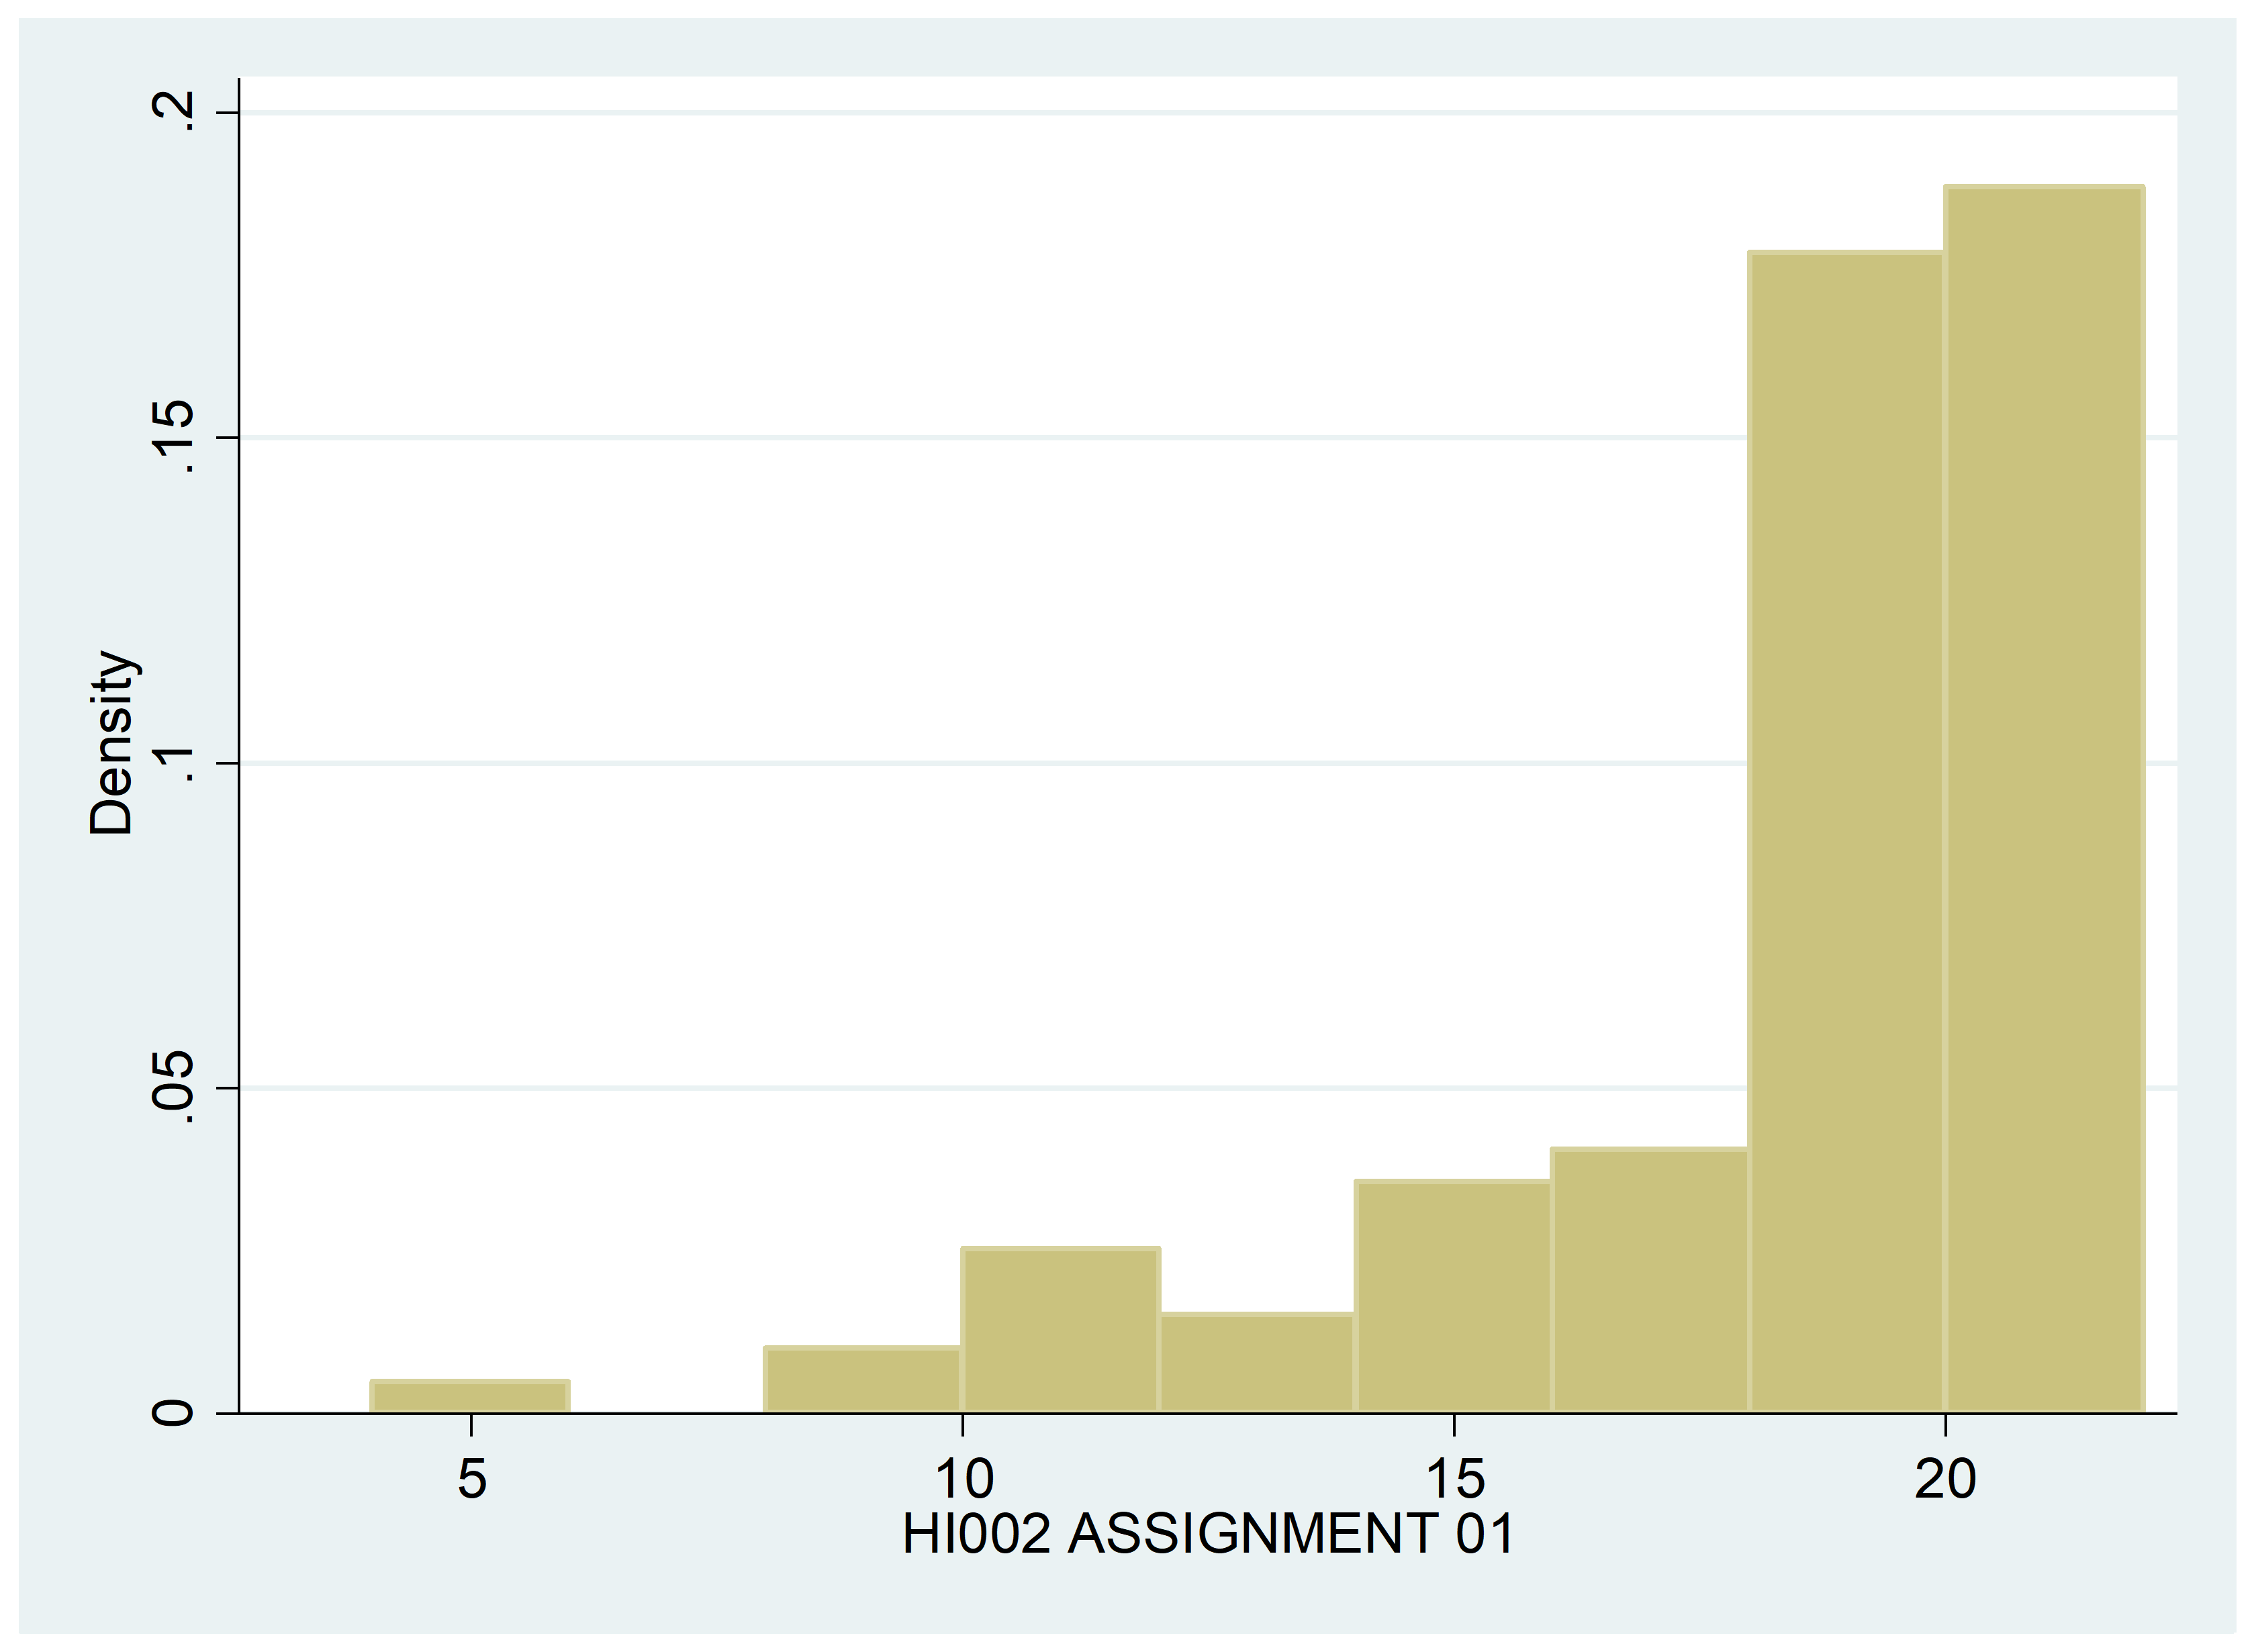
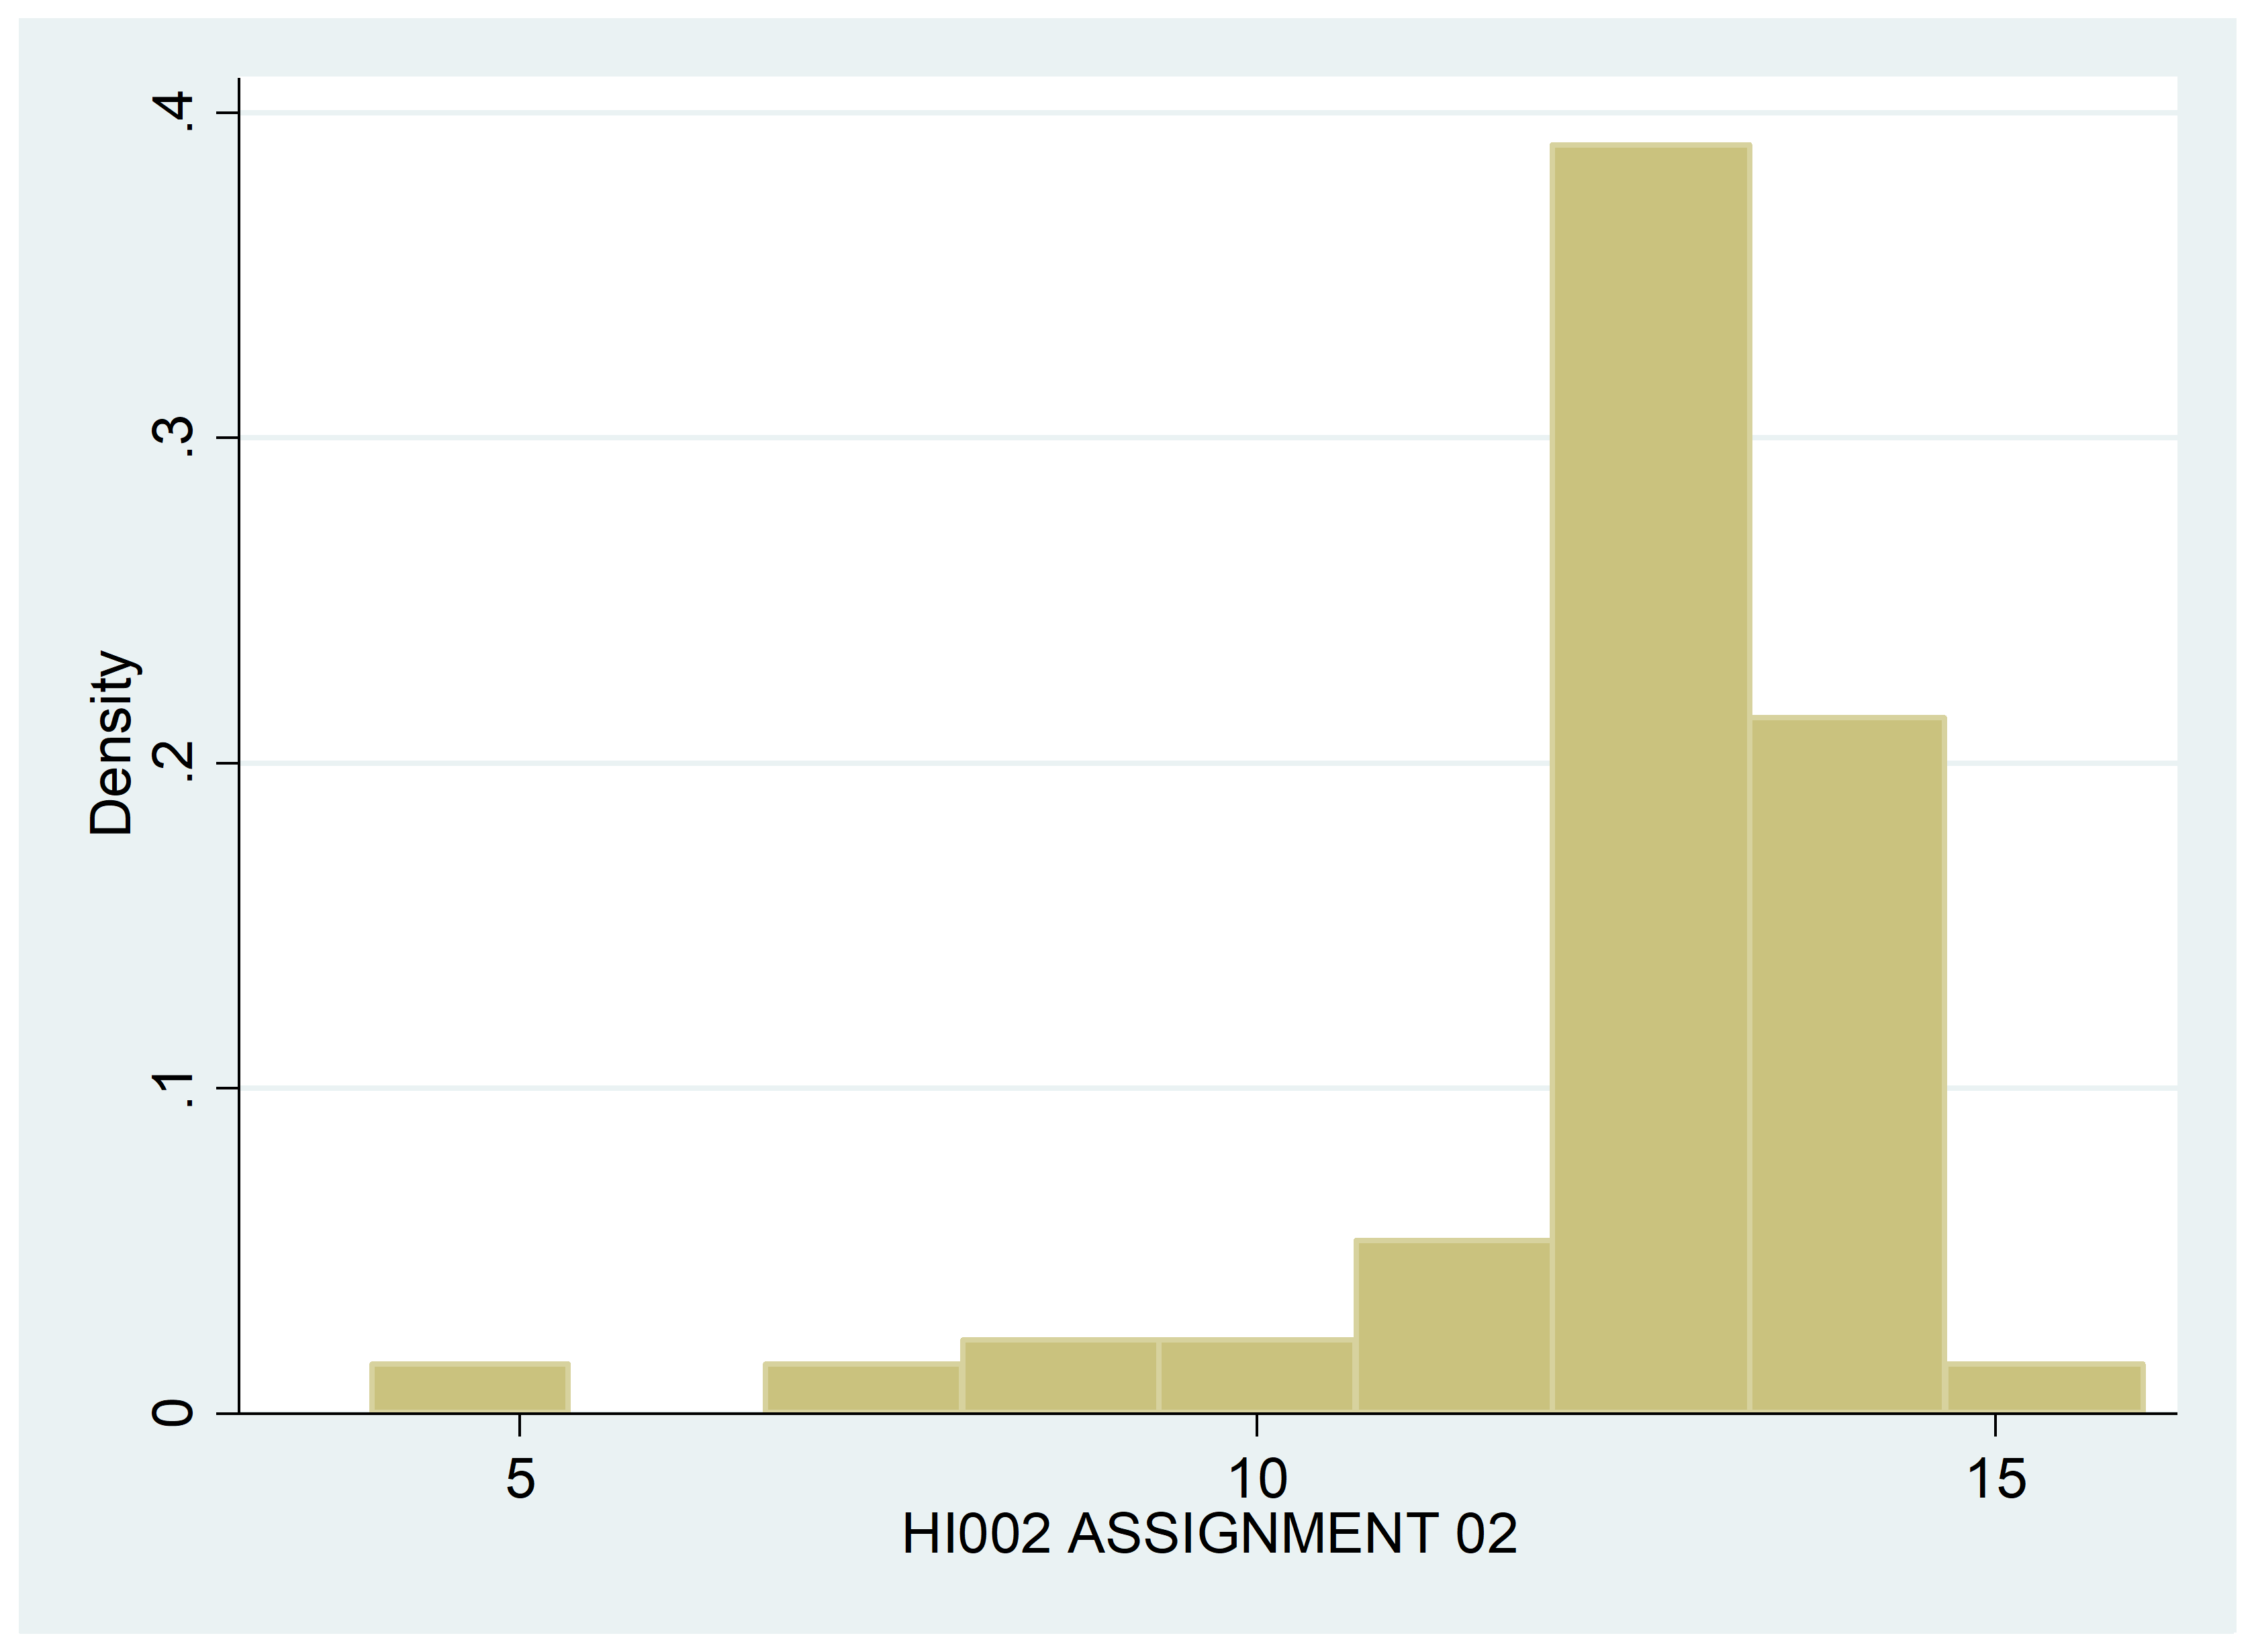
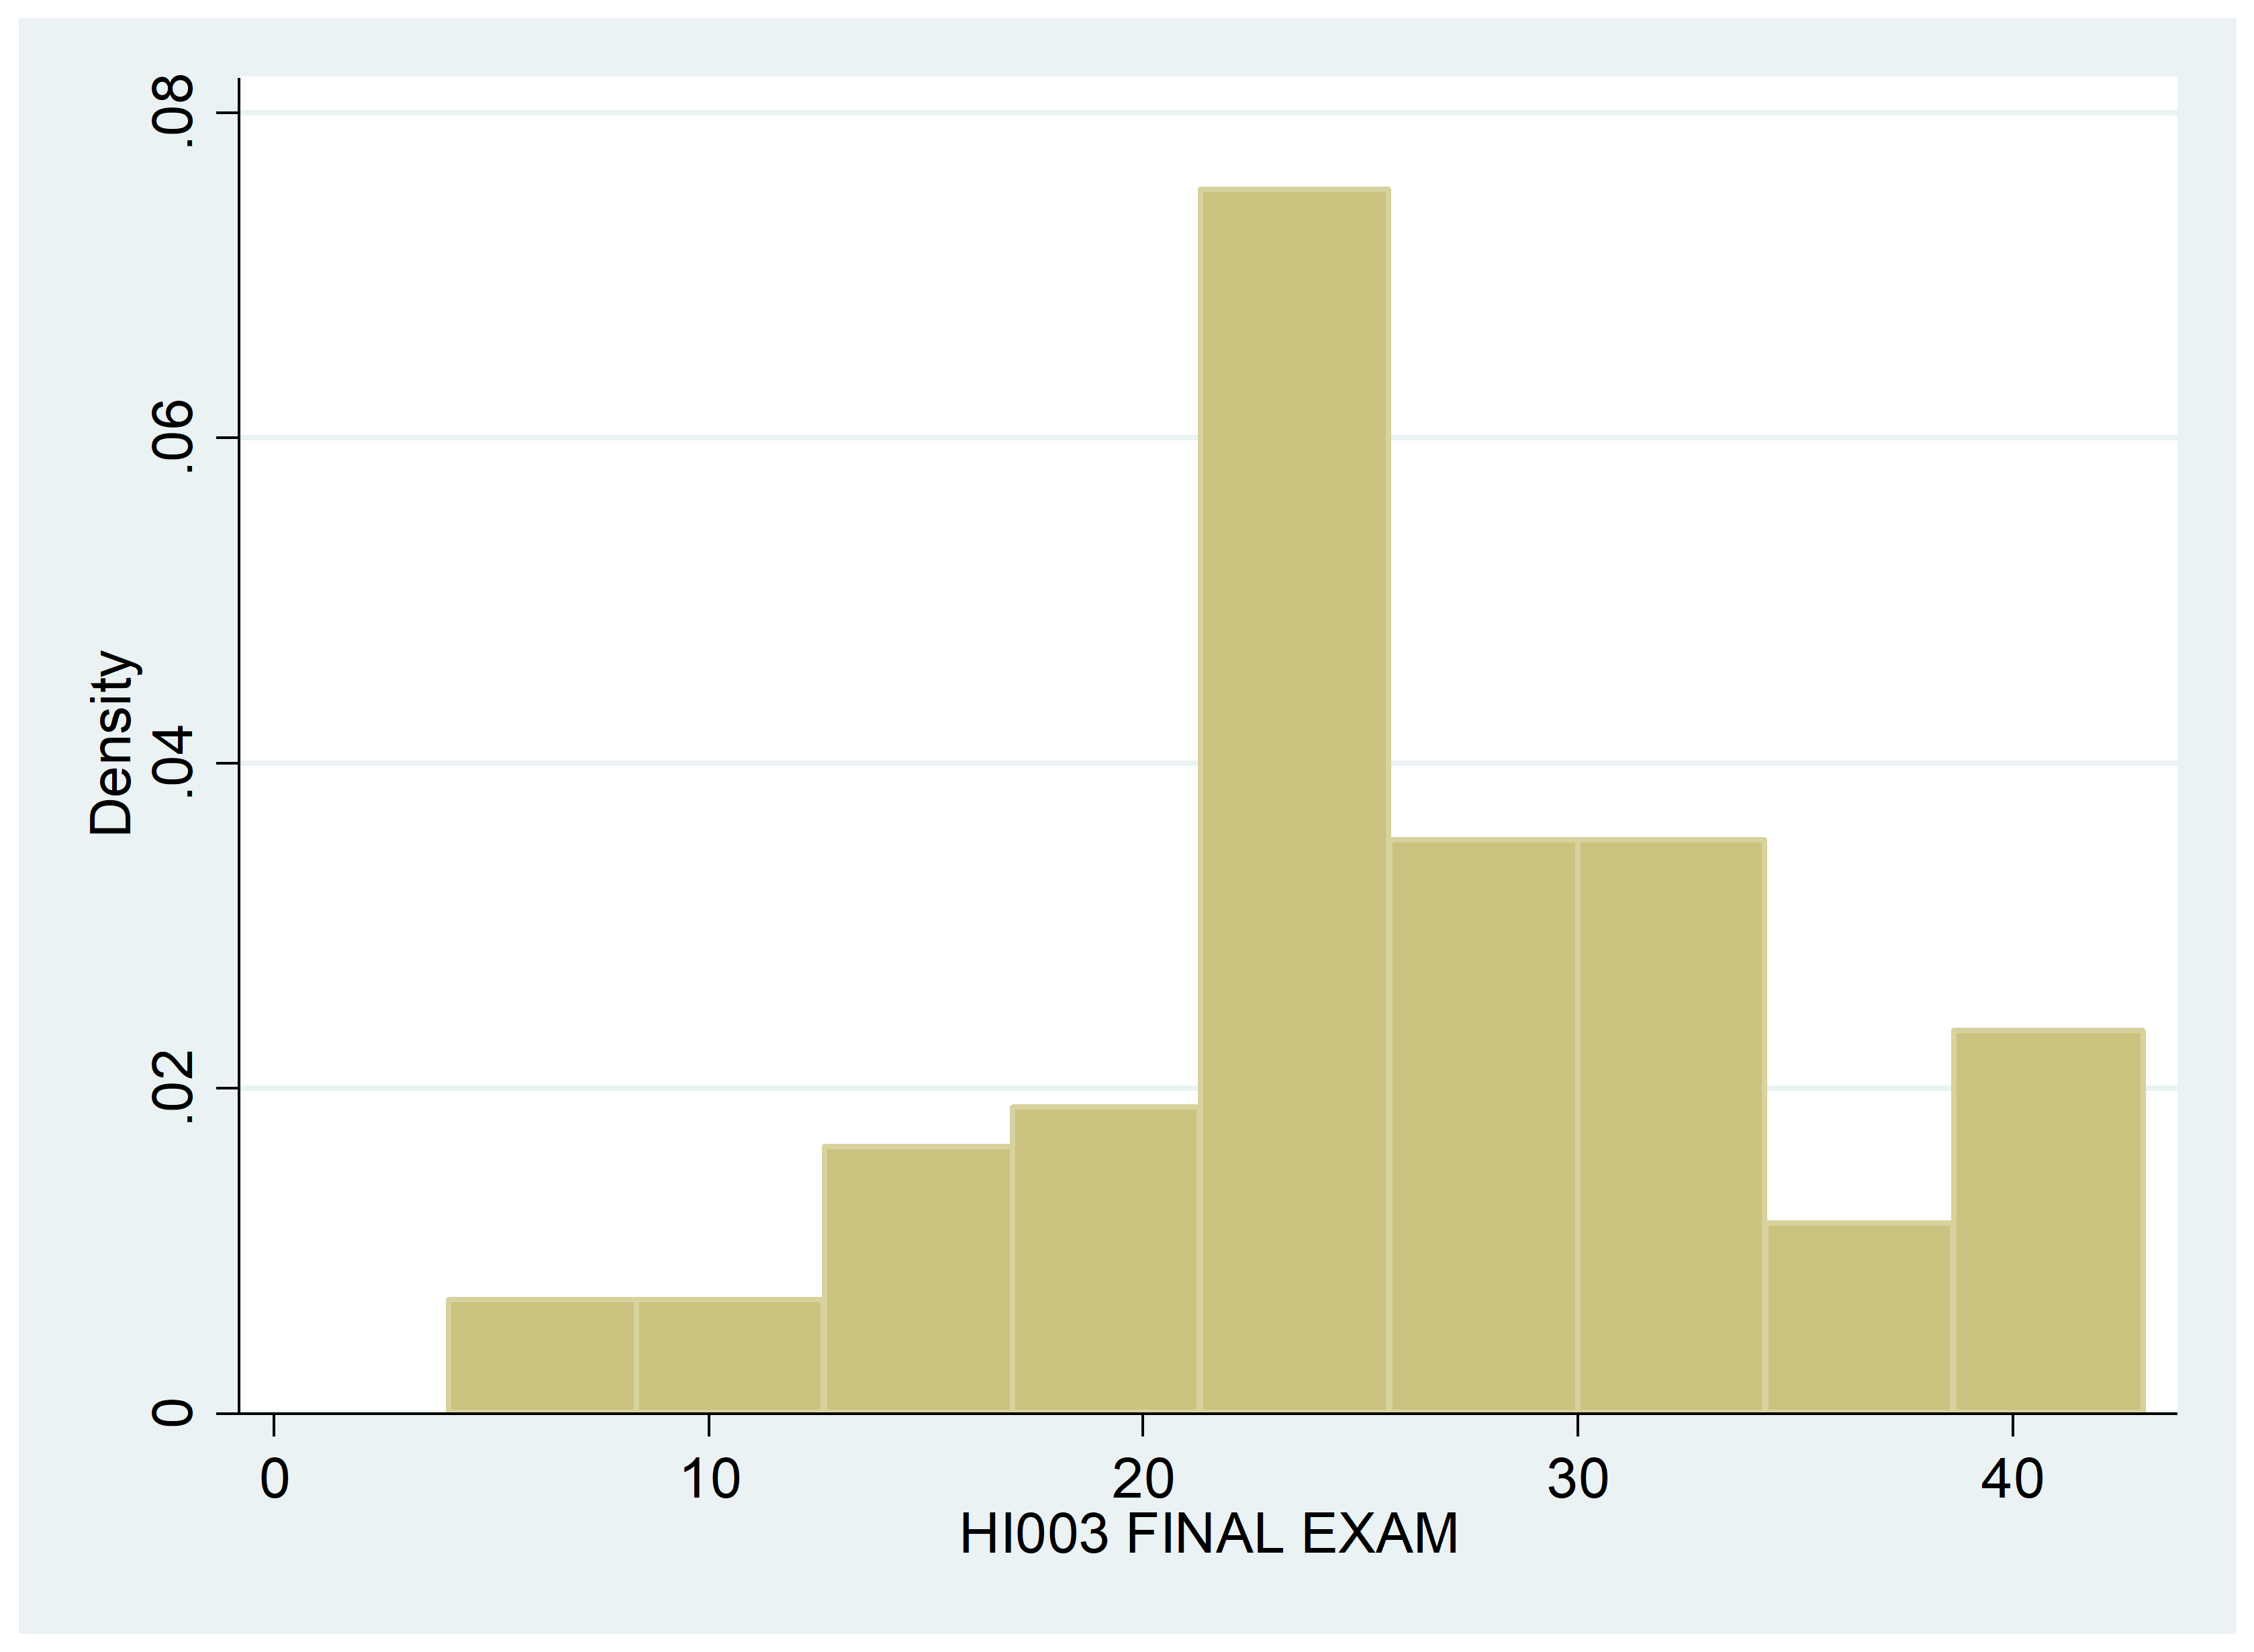
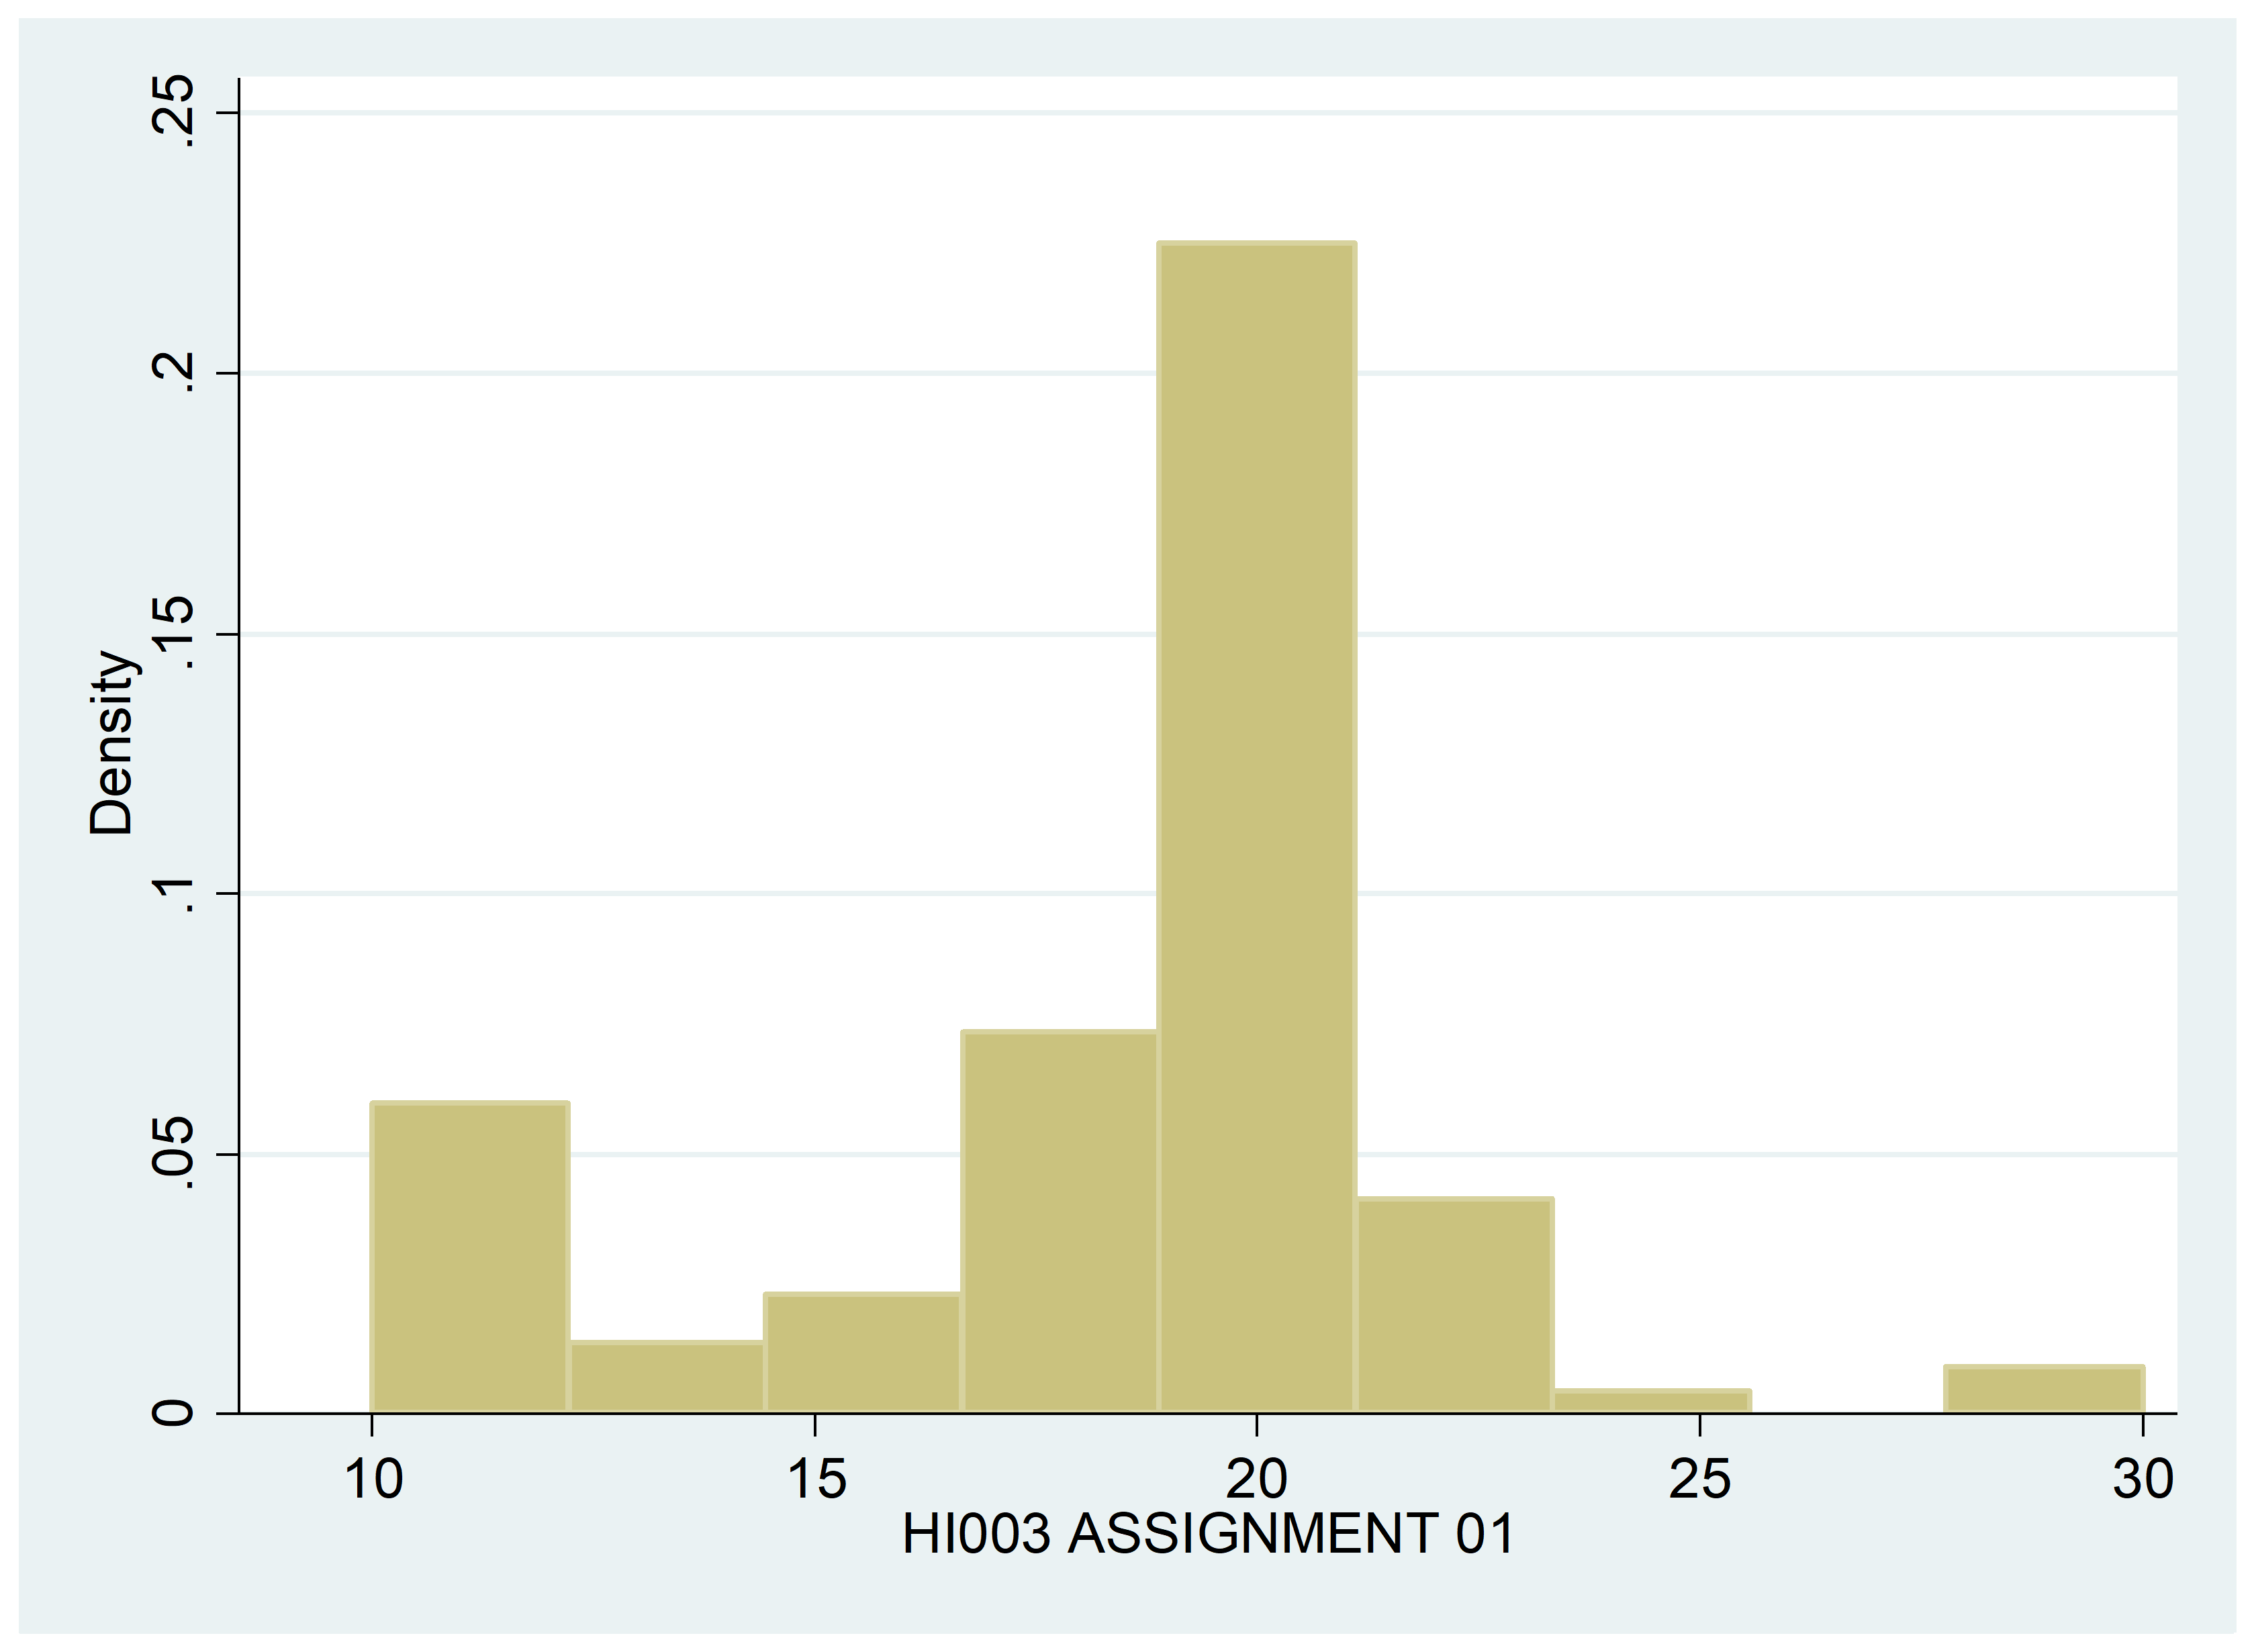
- Draw a histogram for each one of the 11 variables?
- Do descriptive statistics (mean, standard deviation, minimum, maximum) for each one of the 11 variables.
Activity 03:
- Do at least 10 different correlations between the any pairs of variables: For example:
- HI001_Final_Exam and HI002_Final_Exam
- HI001_Assignment_01 and HI001_Assignment_02
- For each correlation discuss the results:
- Are they are positive/negatively correlated?
- Are they weak or strong correlations?
- What is the significance value?
- What does the significance value reveal about the data we have used?
Required:
- Copy –paste the result from your Excel file to a Word document.
- Copy-paste ALL the output from all the activities requested in Activity 01 to 03 in Excel and put the answers in the same Word document.
- Answer all discussion questions requested in Activity 01 to 03 and put the answers in the same Word document.
- Submit a soft copy of the Excel files used in Excel and the Assignment Word document online under Assignment final submission.
The data set for group assignment you can find on Blackboard in the folder assignment.
Required:
- Draw a histogram for each one of the 11 variables?
There is no point making histogram for first two variables as they are string.
- descriptive statistics
| HI001 FINAL EXAM | HI001 ASSIGNMENT 01 | ||
| Mean | 31.7244898 | Mean | 17.21428571 |
| Standard Error | 0.682315554 | Standard Error | 0.201117225 |
| Median | 32 | Median | 17 |
| Mode | 29 | Mode | 18 |
| Standard Deviation | 6.754579374 | Standard Deviation | 1.990958946 |
| Sample Variance | 45.62434252 | Sample Variance | 3.963917526 |
| Kurtosis | 8.420396367 | Kurtosis | 5.441764835 |
| Skewness | -2.062002176 | Skewness | -1.151009411 |
| Range | 45 | Range | 14 |
| Minimum | 0 | Minimum | 8 |
| Maximum | 45 | Maximum | 22 |
| Sum | 3109 | Sum | 1687 |
| Count | 98 | Count | 98 |
| Confidence Level(95.0%) | 1.354207501 | Confidence Level(95.0%) | 0.399162019 |
| HI001 ASSIGNMENT 02 | HI002 FINAL EXAM | ||
| Mean | 15.45918367 | Mean | 26.7244898 |
| Standard Error | 0.233510863 | Standard Error | 0.533099779 |
| Median | 16 | Median | 27 |
| Mode | 17 | Mode | 27 |
| Standard Deviation | 2.311639608 | Standard Deviation | 5.277418559 |
| Sample Variance | 5.343677677 | Sample Variance | 27.85114664 |
| Kurtosis | 0.762136321 | Kurtosis | 0.294860503 |
| Skewness | -0.506514376 | Skewness | -0.079478969 |
| Range | 13 | Range | 28 |
| Minimum | 8 | Minimum | 12 |
| Maximum | 21 | Maximum | 40 |
| Sum | 1515 | Sum | 2619 |
| Count | 98 | Count | 98 |
| Confidence Level(95.0%) | 0.463454424 | Confidence Level(95.0%) | 1.058055491 |
| HI002 ASSIGNMENT 01 | HI002 ASSIGNMENT 02 | ||
| Mean | 17.81632653 | Mean | 12.41836735 |
| Standard Error | 0.347618794 | Standard Error | 0.200946356 |
| Median | 19 | Median | 13 |
| Mode | 20 | Mode | 14 |
| Standard Deviation | 3.441250488 | Standard Deviation | 1.989267437 |
| Sample Variance | 11.84220492 | Sample Variance | 3.957184936 |
| Kurtosis | 3.128381127 | Kurtosis | 4.999175741 |
| Skewness | -1.754639303 | Skewness | -1.922407121 |
| Range | 18 | Range | 12 |
| Minimum | 4 | Minimum | 4 |
| Maximum | 22 | Maximum | 16 |
| Sum | 1746 | Sum | 1217 |
| Count | 98 | Count | 98 |
| Confidence Level(95.0%) | 0.68992708 | Confidence Level(95.0%) | 0.398822893 |
| HI003 FINAL EXAM | HI003 ASSIGNMENT 01 | ||
| Mean | 25.98979592 | Mean | 18.19387755 |
| Standard Error | 0.835577371 | Standard Error | 0.394752601 |
| Median | 25 | Median | 19 |
| Mode | 25 | Mode | 20 |
| Standard Deviation | 8.271793954 | Standard Deviation | 3.907851371 |
| Sample Variance | 68.42257522 | Sample Variance | 15.27130234 |
| Kurtosis | 0.297203879 | Kurtosis | 1.416223038 |
| Skewness | -0.190590175 | Skewness | -0.456615571 |
| Range | 39 | Range | 20 |
| Minimum | 4 | Minimum | 10 |
| Maximum | 43 | Maximum | 30 |
| Sum | 2547 | Sum | 1783 |
| Count | 98 | Count | 98 |
| Confidence Level(95.0%) | 1.658389782 | Confidence Level(95.0%) | 0.783474639 |
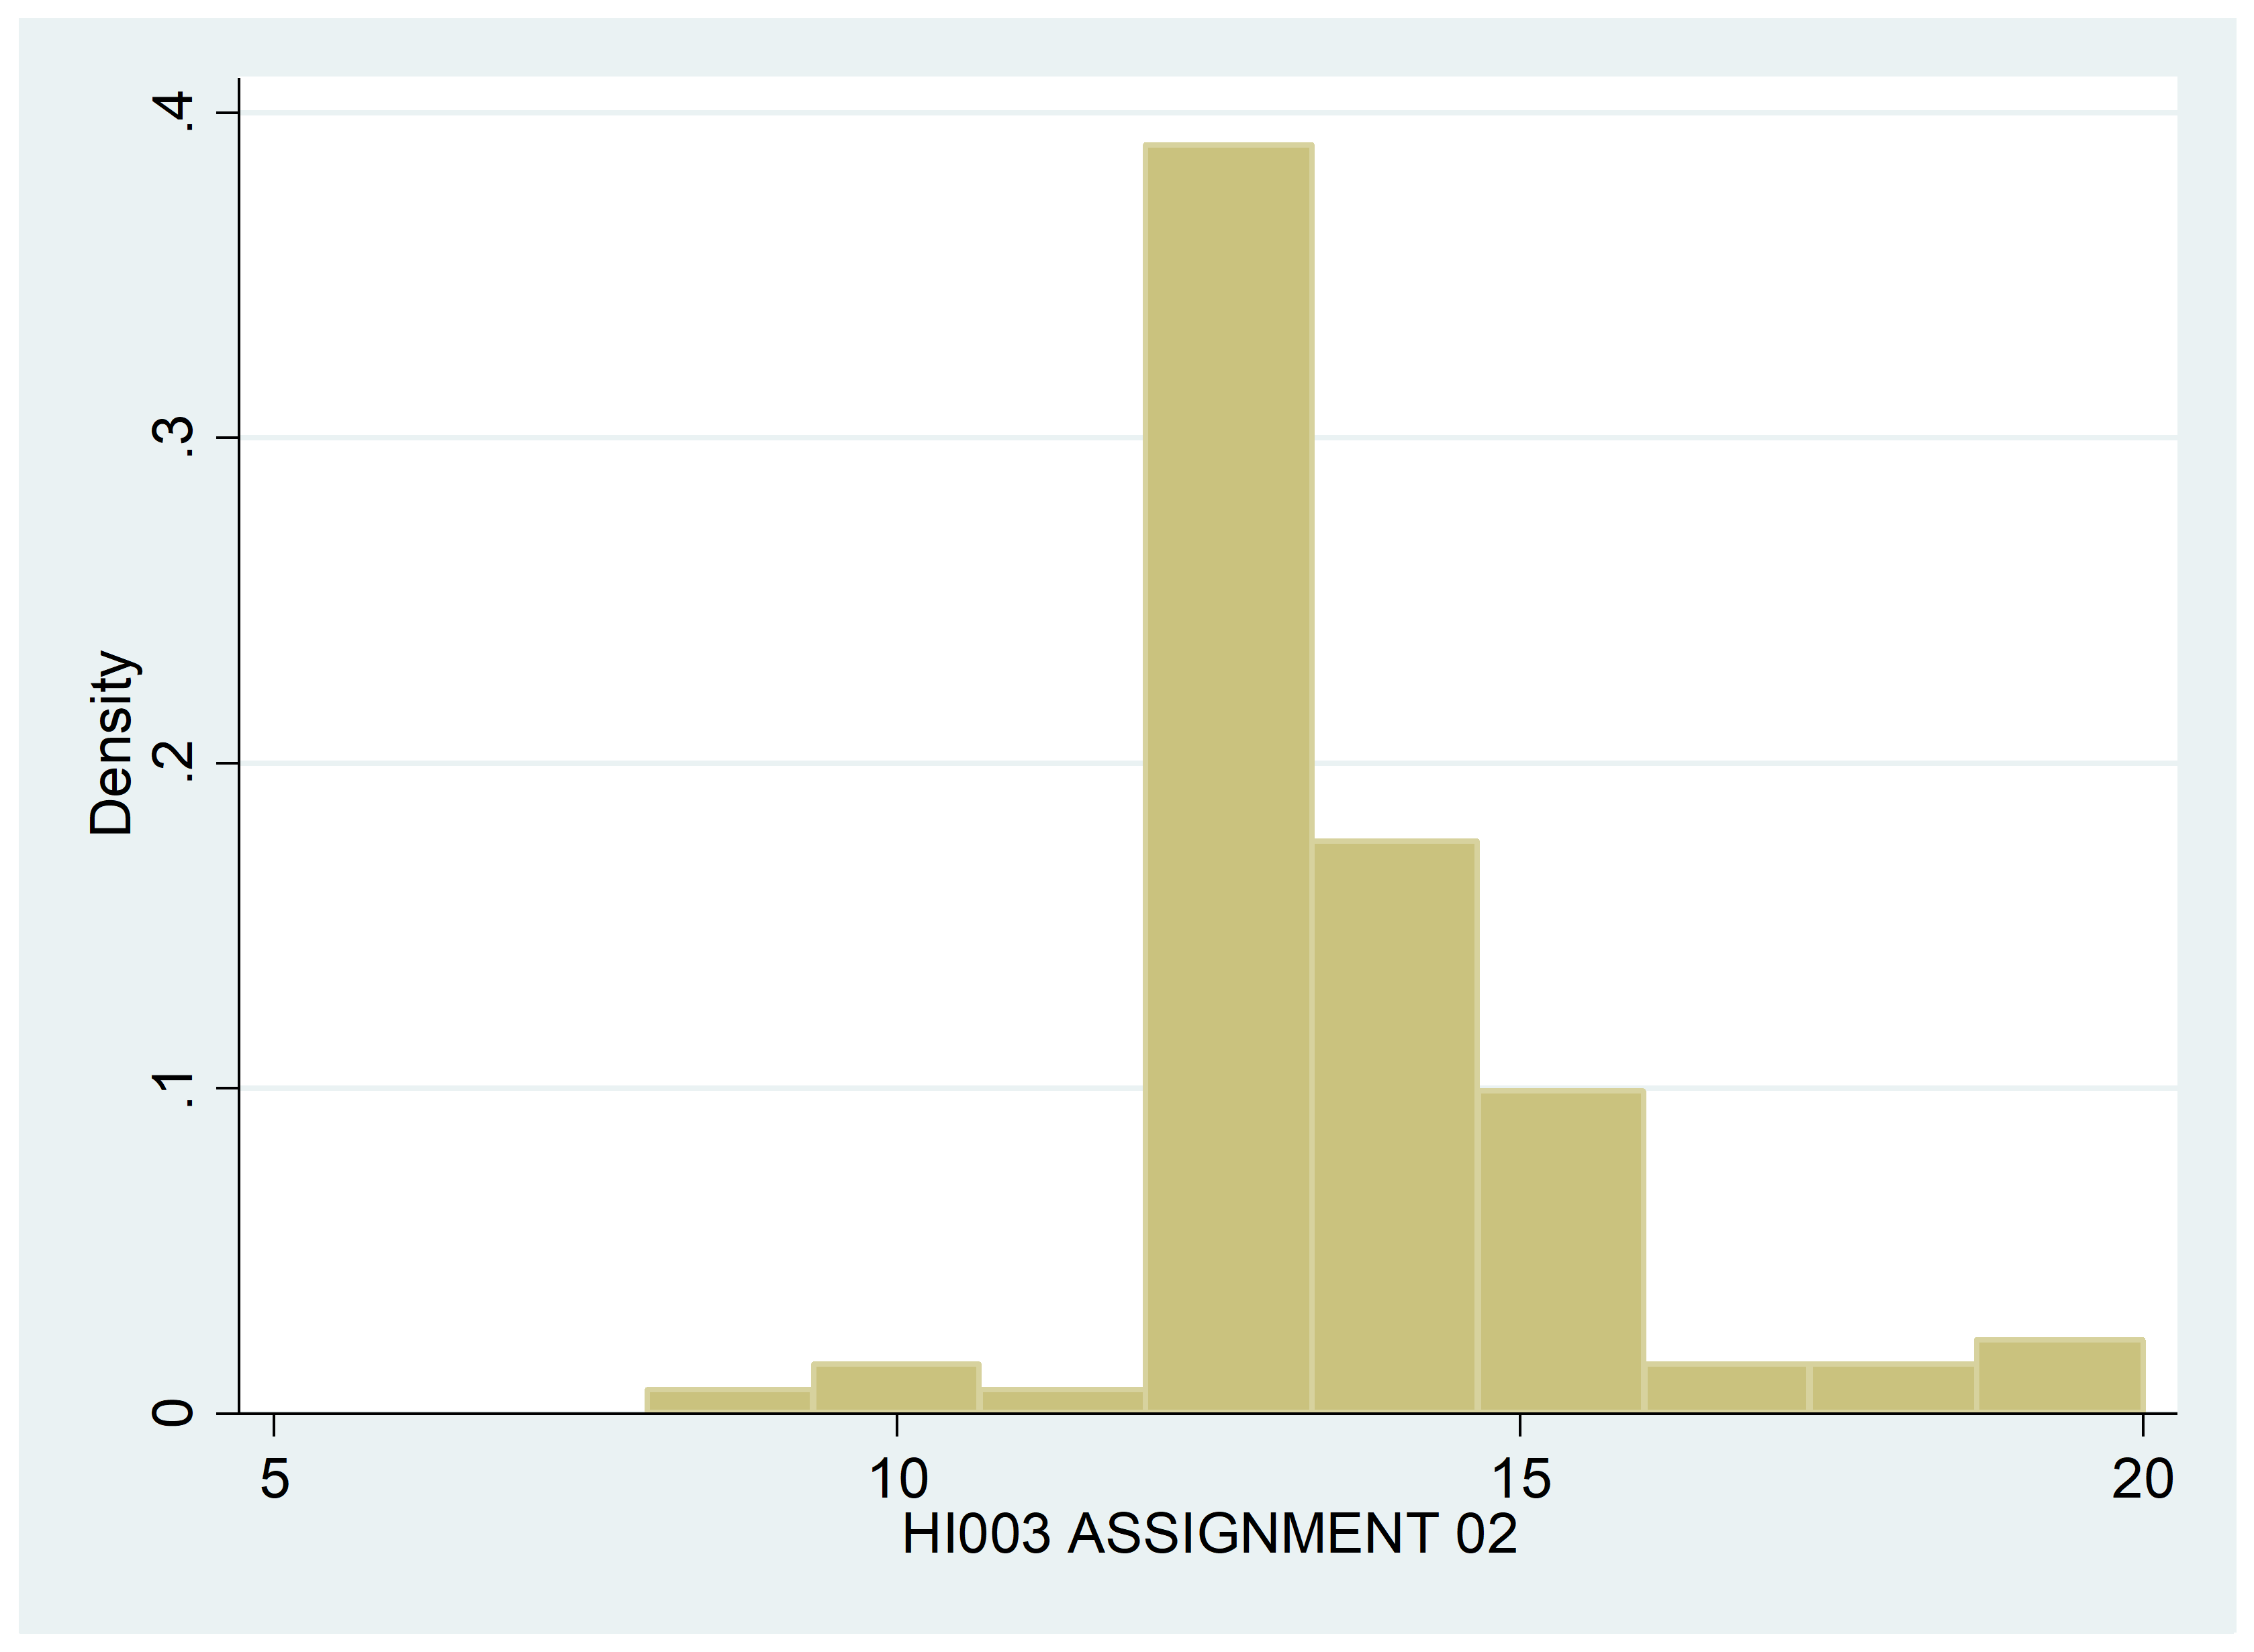
| HI003 ASSIGNMENT 02 | |
| Mean | 13.54081633 |
| Standard Error | 0.177748245 |
| Median | 13 |
| Mode | 13 |
| Standard Deviation | 1.759617855 |
| Sample Variance | 3.096254997 |
| Kurtosis | 3.590146276 |
| Skewness | 0.962380749 |
| Range | 12 |
| Minimum | 8 |
| Maximum | 20 |
| Sum | 1327 |
| Count | 98 |
| Confidence Level(95.0%) | 0.352781064 |
Activity 03:
| CORRELATION | CORRELATION BETWEEN | POSITVE OR NEGATIVE CORRELATION | WEAK OR STRONG | SIGNIFICANCE VALUE | SIGNIFICANT OR NT | WHAT DATA REVEAL |
| 0.0926 | H1001 FINAL EXAM AND ASSIGNMENT T01 | POSITIVE | WEAK | 0.463209502 | YES | HIGHER MARKS IN FINAL EXAM MEANS HIGHER MARKS IN ASSIGNMENT |
| 0.3423 | H1001 FINAL EXAM AND ASSIGNMENT T02 | POSITIVE | STRONG | 0.366446695 | YES | FINAL EXAM MARKS AND ASSIGNMENT 2 MARKS ARE HIGHLY CORRELATED MEANS SOME OF THE CONCEPTS IN FINAL ARE FROM ASSIGNMENT 2 |
| 0.0378 | H1001 FINAL EXAM ANDH1002 FINAL EXAM | POSITIVE | WEAK | 0.484979047 | YES | ( AS SUBJECTS ARE DIFFERENT THE MARKS ARE NOT CORRELATED ALMOST ) |
| -0.0018 | H1001 FINAL EXAM AND H1002 ASSIGNMENT T01 | NEGATIVE | WEAK | 0.499301288 | YES | ( AS SUBJECTS ARE DIFFERENT THE MARKS ARE NOT CORRELATED ALMOST ) |
| -0.0335 | H1001 FINAL EXAM AND H1002 ASSIGNMENT T02 | NEGATIVE | WEAK | 0.486660005 | YES | ( AS SUBJECTS ARE DIFFERENT THE MARKS ARE NOT CORRELATED ALMOST ) |
| 0.1219 | H1001 FINAL EXAM ANDH1003 FINAL EXAM | POSITIVE | WEAK | 0.451611307 | YES | AS FINAL EXAMS HAVE SAME PATTERN OR WE CAN SAY IF WE HIGH MARKS IN ONE EXAM IT TENDS TO GIVE BETTER RESULTS IN NEXT EXAM |
| -0.0437 | H1001 FINAL EXAM AND H1003 ASSIGNMENT T01 | NEGATIVE | WEAK | 0.482636443 | YES | ( AS SUBJECTS ARE DIFFERENT THE MARKS ARE NOT CORRELATED ALMOST ) |
| 0.2191 | H1001 FINAL EXAM AND H1003 ASSIGNMENT T02 | POSITIVE | WEAK | 0.413517463 | YES | THERE SEEMS SOME SPURIOUS CORRELATION |
| 0.6594 | H1001 ASSIGNMENT T01 AND H1001 ASSIGNMENT T02 | POSITIVE | STRONG | 0.255622679 | YES | IF ONE STUDENT GETS HIGH MARKS IN ONE ASSIGNMENT THEN HE IS TEND TO GET HIGHER IN OTHER TOO BECAUSE OF THE SAME SUBJECTS AND IDENTICAL CONCEPTS |
| -0.0002 | H1002 FINAL EXAM AND H1001 ASSIGNMENT T01 | NEGATIVE | WEAK | 0.49991634 | YES | ( AS SUBJECTS ARE DIFFERENT THE MARKS ARE NOT CORRELATED ALMOST ) |
| -0.1311 | H1001 ASSIGNMENT T01 AND H1002 ASSIGNMENT T01 | NEGATIVE | WEAK | 0.447975893 | YES | FOCUS ON ONE SUBJECT LEADS TO LESS MARK IN OTHER |
Leave an answer